Do you live in one of the most miserable places in Kentucky?
Only a third of Kentuckians say they are truly happy. That’s too bad, considering that folks in Kentucky don’t really have it too bad in the grand scheme of things.
But, we were curious – which Kentucky cities might be the most miserable? We’re about to find out, using Saturday Night Science and data.
After analyzing the 80 largest cities, we sadly present the most miserable cities in the Bluegrass State.
Table Of Contents: Top Ten | Methodology | Summary | Table
The 10 Most Miserable Places In Kentucky
Read on below to see how we crunched the numbers and how your town ranked. If you have a smile on your face, you probably don’t live in one of these cities.
Oh, and by the way, Pikeville is the happiest place in Kentucky.
For more Kentucky reading, check out:
The 10 Most Miserable Places In Kentucky For 2023
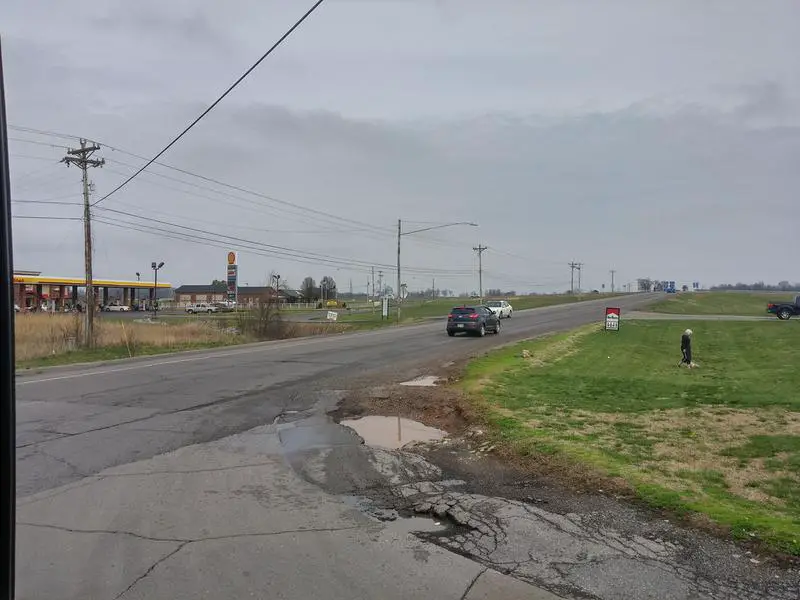
/10
Population: 7,699
Poverty Level: 16.3%
Median Home Price $116,100
Married Households 3.0%
Households With Kids 46.66%
More on Oak Grove: Data | Crime | Cost Of Living
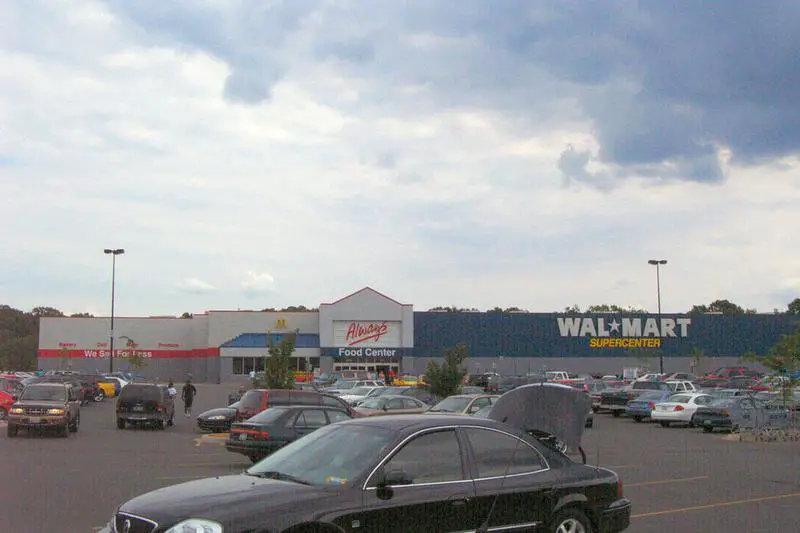
/10
Population: 22,839
Poverty Level: 18.2%
Median Home Price $130,100
Married Households 11.0%
Households With Kids 35.3%
More on Radcliff: Data | Crime | Cost Of Living
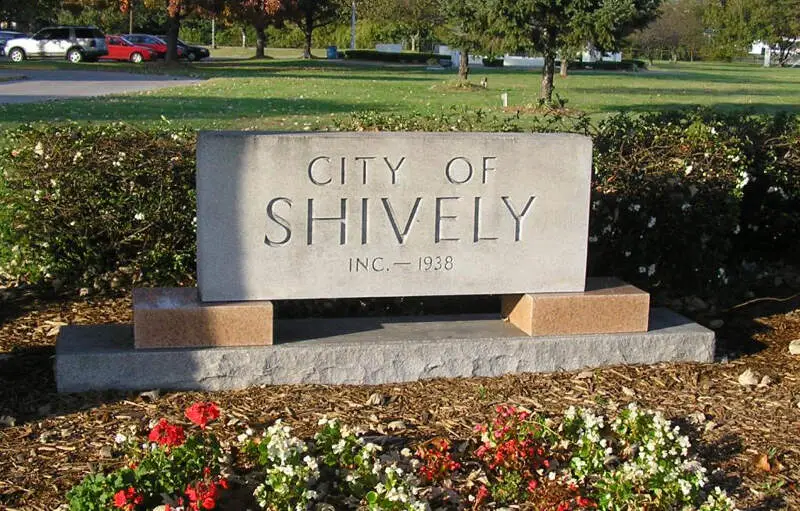
/10
Population: 15,638
Poverty Level: 18.2%
Median Home Price $114,800
Married Households 22.0%
Households With Kids 31.09%
More on Shively: Data | Crime | Cost Of Living
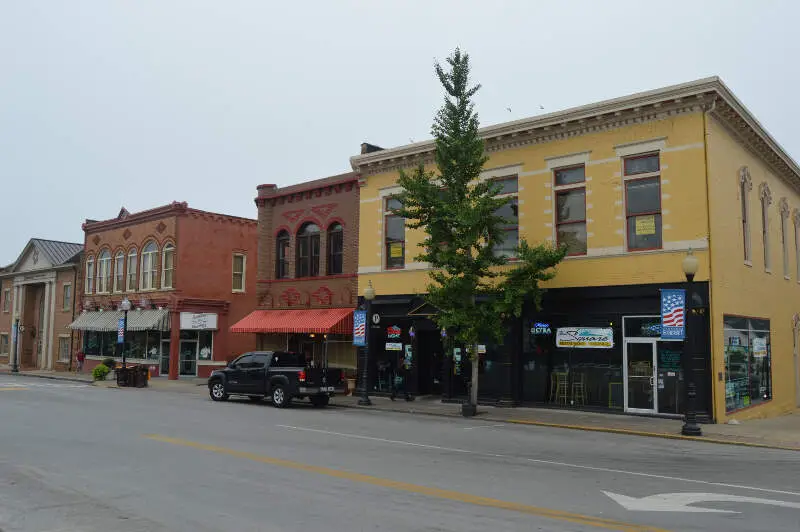
/10
Population: 11,696
Poverty Level: 30.6%
Median Home Price $117,000
Married Households 25.0%
Households With Kids 33.98%
More on Somerset: Data | Crime | Cost Of Living
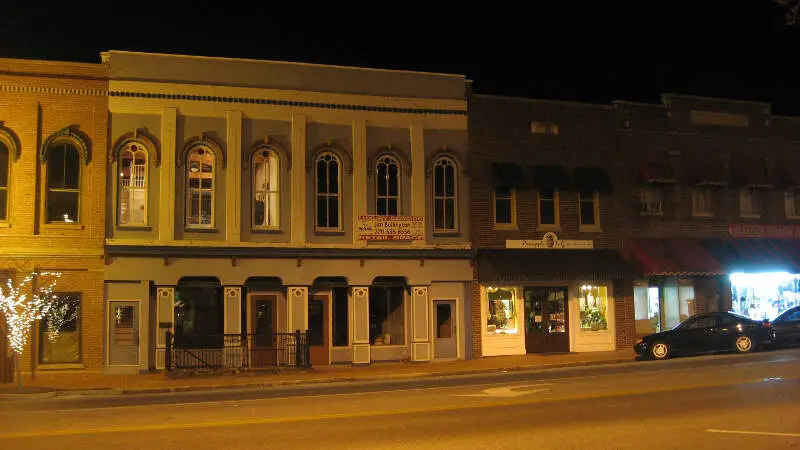
/10
Population: 9,885
Poverty Level: 16.4%
Median Home Price $135,000
Married Households 23.0%
Households With Kids 34.55%
More on Franklin: Data | Crime | Cost Of Living
/10
Population: 6,397
Poverty Level: 8.2%
Median Home Price $170,700
Married Households 13.0%
Households With Kids 44.58%
More on Vine Grove: Data | Crime | Cost Of Living
/10
Population: 17,723
Poverty Level: 7.2%
Median Home Price $198,300
Married Households 42.0%
Households With Kids 39.64%
More on Mount Washington: Data | Crime | Cost Of Living
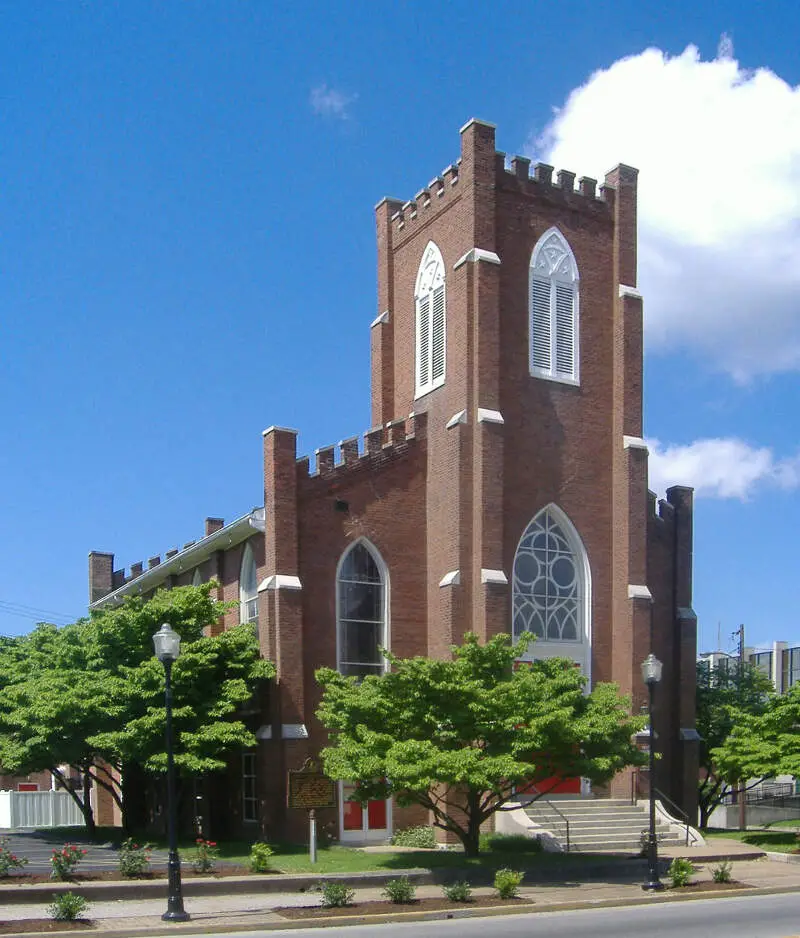
/10
Population: 30,771
Poverty Level: 20.4%
Median Home Price $120,100
Married Households 19.0%
Households With Kids 31.7%
More on Hopkinsville: Data | Crime | Cost Of Living
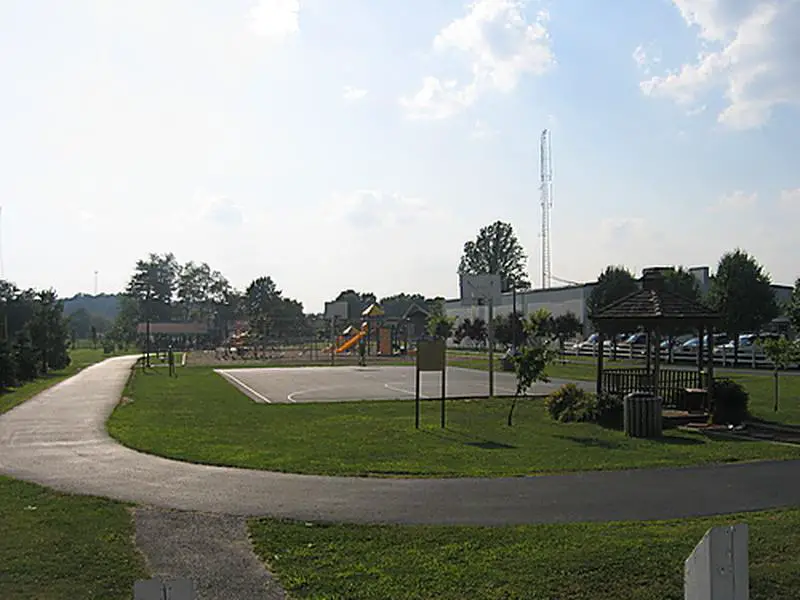
/10
Population: 7,314
Poverty Level: 14.8%
Median Home Price $100,200
Married Households 27.0%
Households With Kids 28.99%
More on Flatwoods: Data | Crime | Cost Of Living
/10
Population: 9,080
Poverty Level: 13.7%
Median Home Price $124,600
Married Households 23.0%
Households With Kids 34.64%
More on Elsmere: Data | Crime | Cost Of Living
Methodology: How We Measured The Most Miserable Cities In The Bluegrass State
To rank the unhappiest places in Kentucky, we had to determine what criteria make people happy. It isn’t a stretch to assume that happy people earn great salaries, are relatively stress-free, and have a stable home life.
So we went to the Census’s American Community Survey 2017-2021 report for the happy criteria, flipped the list with Saturday Night Science, and it spit out the answer.
Like magic.
Here are the criteria we used to measure misery:
- Percentage of residents with a college degree
- Average commute times
- Unemployment rates
- Cost of living
- % of married couples
- % of families with kids
- Poverty rate
After we decided on the criteria, we gathered the data for the 80 places in Kentucky with over 5,000 people.
We then ranked each place from one to 80 for each of the seven criteria, with a score of one being the most miserable (Any ties were given to the larger place).
Next, we averaged the seven rankings into a Miserable Index for each place with the lowest overall Miserable Index “earning” the title “Most Miserable City In Kentucky.”
If you’d like to see the complete list of states, most miserable to happiest, scroll to the bottom of this post to see the unabridged chart.
We updated this article for 2023, and it’s our tenth time ranking the most miserable cities in Kentucky.
There You Have It – The Least Happy Cities In Kentucky
As we said earlier, trying to determine the most miserable cities in Kentucky is usually a subjective matter.
But if you’re analyzing cities where people are not stable, where you’re stuck in traffic, and no one spent the time to go to college, then this is an accurate list.
If you’re curious enough, here are the happiest cities in Kentucky, according to science:
- Pikeville
- Fort Wright
- Bellevue
For more Kentucky reading, check out:
- Best Places To Live In Kentucky
- Cheapest Places To Live In Kentucky
- Most Dangerous Cities In Kentucky
- Richest Cities In Kentucky
- Safest Places In Kentucky
- Worst Places To Live In Kentucky
- Most Expensive Places To Live In Kentucky
Miserable Cities In Kentucky For 2023
| Rank | City | Population | Poverty Level | Median Home Value | % Married | % Kids |
|---|---|---|---|---|---|---|
| 1 | Oak Grove, KY | 7,699 | 16.3% | $116,100 | 3.0% | 46.66% |
| 2 | Radcliff, KY | 22,839 | 18.2% | $130,100 | 11.0% | 35.3% |
| 3 | Shively, KY | 15,638 | 18.2% | $114,800 | 22.0% | 31.09% |
| 4 | Somerset, KY | 11,696 | 30.6% | $117,000 | 25.0% | 33.98% |
| 5 | Franklin, KY | 9,885 | 16.4% | $135,000 | 23.0% | 34.55% |
| 6 | Vine Grove, KY | 6,397 | 8.2% | $170,700 | 13.0% | 44.58% |
| 7 | Mount Washington, KY | 17,723 | 7.2% | $198,300 | 42.0% | 39.64% |
| 8 | Hopkinsville, KY | 30,771 | 20.4% | $120,100 | 19.0% | 31.7% |
| 9 | Flatwoods, KY | 7,314 | 14.8% | $100,200 | 27.0% | 28.99% |
| 10 | Elsmere, KY | 9,080 | 13.7% | $124,600 | 23.0% | 34.64% |
| 11 | Ashland, KY | 21,695 | 23.0% | $106,400 | 25.0% | 31.54% |
| 12 | Corbin, KY | 8,397 | 21.4% | $129,500 | 29.0% | 39.11% |
| 13 | Winchester, KY | 18,993 | 19.6% | $139,800 | 30.0% | 33.72% |
| 14 | Hillview, KY | 8,638 | 8.5% | $136,800 | 41.0% | 33.82% |
| 15 | Florence, KY | 31,699 | 7.7% | $158,800 | 16.0% | 28.41% |
| 16 | Central City, KY | 5,958 | 16.3% | $111,300 | 39.0% | 35.71% |
| 17 | Princeton, KY | 6,206 | 16.6% | $75,000 | 37.0% | 34.48% |
| 18 | Crestwood, KY | 6,046 | 7.4% | $277,700 | 25.0% | 53.71% |
| 19 | Walton, KY | 5,333 | 5.6% | $174,200 | 34.0% | 48.01% |
| 20 | Lawrenceburg, KY | 11,675 | 14.3% | $149,600 | 33.0% | 32.7% |
| 21 | Nicholasville, KY | 31,066 | 14.9% | $160,900 | 32.0% | 34.11% |
| 22 | Shelbyville, KY | 16,932 | 9.9% | $192,900 | 27.0% | 37.6% |
| 23 | Williamsburg, KY | 5,272 | 27.9% | $93,100 | 19.0% | 31.64% |
| 24 | Glasgow, KY | 14,922 | 27.3% | $127,300 | 27.0% | 33.85% |
| 25 | Russellville, KY | 7,068 | 22.4% | $98,900 | 33.0% | 31.2% |
| 26 | Independence, KY | 28,256 | 7.7% | $190,200 | 29.0% | 40.39% |
| 27 | Covington, KY | 40,930 | 23.9% | $130,500 | 16.0% | 25.15% |
| 28 | Bardstown, KY | 13,425 | 12.7% | $143,600 | 29.0% | 31.76% |
| 29 | Hazard, KY | 5,236 | 26.7% | $117,600 | 21.0% | 30.5% |
| 30 | Mayfield, KY | 10,041 | 29.9% | $107,400 | 21.0% | 28.68% |
| 31 | Harrodsburg, KY | 8,952 | 15.5% | $120,600 | 24.0% | 23.92% |
| 32 | La Grange, KY | 9,901 | 9.7% | $210,600 | 28.0% | 40.84% |
| 33 | Dayton, KY | 5,641 | 19.6% | $112,800 | 24.0% | 24.96% |
| 34 | Monticello, KY | 5,782 | 30.9% | $112,800 | 33.0% | 33.68% |
| 35 | Elizabethtown, KY | 31,066 | 12.0% | $180,400 | 20.0% | 29.14% |
| 36 | Middlesborough, KY | 9,493 | 32.0% | $72,600 | 28.0% | 25.51% |
| 37 | Cynthiana, KY | 6,291 | 27.7% | $121,200 | 35.0% | 32.51% |
| 38 | Danville, KY | 17,164 | 17.6% | $149,200 | 23.0% | 27.6% |
| 39 | Madisonville, KY | 19,533 | 22.6% | $130,600 | 32.0% | 32.75% |
| 40 | Mount Sterling, KY | 7,517 | 23.7% | $147,800 | 30.0% | 33.04% |
| 41 | Shepherdsville, KY | 13,918 | 18.7% | $162,600 | 38.0% | 35.87% |
| 42 | Louisville, KY | 630,260 | 15.2% | $174,400 | 24.0% | 28.24% |
| 43 | Frankfort, KY | 28,479 | 16.3% | $135,800 | 23.0% | 32.45% |
| 44 | Berea, KY | 15,465 | 17.7% | $138,900 | 28.0% | 31.89% |
| 45 | Erlanger, KY | 19,506 | 10.6% | $148,500 | 24.0% | 29.86% |
| 46 | Alexandria, KY | 10,125 | 7.0% | $214,600 | 36.0% | 39.94% |
| 47 | Henderson, KY | 28,201 | 20.0% | $122,700 | 28.0% | 29.34% |
| 48 | Union, KY | 7,227 | 1.4% | $292,000 | 26.0% | 52.64% |
| 49 | Newport, KY | 14,378 | 23.2% | $168,800 | 18.0% | 21.21% |
| 50 | Leitchfield, KY | 6,427 | 27.5% | $118,800 | 23.0% | 26.94% |
| 51 | Fort Mitchell, KY | 8,618 | 3.4% | $277,600 | 23.0% | 33.23% |
| 52 | Paris, KY | 10,202 | 15.6% | $140,800 | 32.0% | 28.18% |
| 53 | Lebanon, KY | 6,165 | 27.2% | $109,700 | 30.0% | 18.87% |
| 54 | Richmond, KY | 34,662 | 24.3% | $157,200 | 20.0% | 24.67% |
| 55 | Bowling Green, KY | 71,422 | 25.5% | $171,600 | 17.0% | 30.93% |
| 56 | Taylor Mill, KY | 6,834 | 9.8% | $179,200 | 24.0% | 35.35% |
| 57 | Fort Thomas, KY | 17,241 | 5.9% | $236,900 | 28.0% | 37.17% |
| 58 | Maysville, KY | 8,851 | 21.9% | $135,500 | 29.0% | 28.69% |
| 59 | Jeffersontown, KY | 28,800 | 6.5% | $196,500 | 31.0% | 29.57% |
| 60 | Georgetown, KY | 36,281 | 12.3% | $186,300 | 32.0% | 39.82% |
| 61 | Owensboro, KY | 59,839 | 20.2% | $131,600 | 30.0% | 31.35% |
| 62 | Campbellsville, KY | 11,345 | 21.5% | $132,600 | 28.0% | 20.92% |
| 63 | Villa Hills, KY | 7,331 | 3.4% | $236,800 | 29.0% | 29.84% |
| 64 | Lexington, KY | 321,354 | 15.7% | $216,800 | 21.0% | 27.49% |
| 65 | Middletown, KY | 9,473 | 8.8% | $241,600 | 22.0% | 21.32% |
| 66 | Douglass Hills, KY | 5,480 | 2.8% | $278,600 | 31.0% | 28.06% |
| 67 | Paducah, KY | 26,248 | 22.7% | $125,800 | 24.0% | 24.35% |
| 68 | Wilmore, KY | 6,025 | 16.7% | $175,600 | 19.0% | 32.51% |
| 69 | Versailles, KY | 10,196 | 9.7% | $196,800 | 28.0% | 27.86% |
| 70 | Edgewood, KY | 8,427 | 3.2% | $238,700 | 32.0% | 34.38% |
| 71 | Murray, KY | 17,241 | 22.8% | $161,800 | 15.0% | 26.49% |
| 72 | Lyndon, KY | 11,033 | 8.1% | $219,400 | 18.0% | 17.68% |
| 73 | Morehead, KY | 6,994 | 35.2% | $154,300 | 13.0% | 20.29% |
| 74 | London, KY | 7,492 | 27.4% | $132,700 | 34.0% | 31.07% |
| 75 | Cold Spring, KY | 6,208 | 5.2% | $194,100 | 31.0% | 26.55% |
| 76 | St. Matthews, KY | 17,588 | 8.0% | $268,400 | 22.0% | 17.19% |
| 77 | Highland Heights, KY | 6,896 | 24.9% | $126,600 | 12.0% | 21.82% |
| 78 | Bellevue, KY | 5,578 | 12.4% | $148,900 | 24.0% | 24.45% |
| 79 | Fort Wright, KY | 5,845 | 4.4% | $222,500 | 26.0% | 20.53% |
| 80 | Pikeville, KY | 7,376 | 27.1% | $235,100 | 25.0% | 22.55% |

Really? You based this story on such ridiculous criteria? I don’t have a college degree, I drive 2.5 miles to work to a job I’ve had for 22 years (some days it takes a full 10 minutes to get there), the last time I was stuck in traffic in Stanford was waiting on the left turn arrow at the 27/150 intersection. It took about 1 1/2 minutes. Let me tell you….I was stressed. I am happily married, own my home and have never thought the cost of living in Stanford was considered high. This is just another pathetic college boy attempt to show the world how miserable us country folks are. Let me tell ya a secret….. I for one am very happy. I can sit on my front porch with my big ‘ol glass of sweet tea and look at the beautiful country side. I live in a very nice home (indoor plumbing and everything) and consider myself stable ( financially & mentally). So college boy….. why don’t ya come on down here and sit on the porch with us or maybe pitch a game of cornhole. We’ll play fetch with the dog and when we’re tired we’ll go in the house and turn on our satellite T.V. or maybe even get on the internet with our smart phone. When it’s bedtime we will lay down with a full belly (cuz we got a job and can afford some pretty good grub) and a full heart (cuz we know how blessed we are and we know how to say thank you God). And speaking of blessed…… you know this country girl gotta say…. Well Nick….. Bless Your Heart.
I immediately see a major flaw in your research. I live in Richmond and know that most of the residents don’t own their home and are unmarried due to being college students. I would assume this also affects salary. Maybe you should take that variable into consideration when posting “researched” statistics. Richmond is a known college town.
Irvine is at the bottom of the list for anything for our young people to do! Have to drive to towns around us for kids to b able to swim , skate, go c a movie anything! Why not spend some money for our young people! Maybe it would cut down on the drug problem ! They have nothing to do with their free time unless u travel to nearby towns! Why spend our money in other towns when we could do it here. More jobs too! It’s a win win situation. Wake up!
I agree with what you said about the kids not having anything to do. However happiness is not where you live it is what is in your heart. I’m not trying to be philosophical I’m just saying the things that they used to rate miserable are not accurate. Sure, it would be better if I didn’t have to drive 50 to 60 miles a day (one way) to work, but I have done it for years. It is what it is. It doesn’t effect my happiness. Happiness comes from inside. Family and loved ones. I would apologize for this but I won’t..No God, No happiness….Know God, Know happiness….NO matter where you live.
I was born and raised in Henderson, spent 7 years living in Richmond, 2 in Berea, 1 in Morganfield, 2 in Poole, and currently live in Smyrna TN now. Based on all of those years, and comparing it to were I live now….
I have to say that you are absolutely RIGHT when you say Richmond is a MISERABLE place to live. The sorry excuse of a school system, SCHOOL BUS system, overall cost of living (rent) for a small townhome……. College kid drama…. massage parlors on every other corner..
Henderson would have been second on my list. People born there typically dont leave there… and they are always LAST to get things. If I remember right, there was like a 10 year period that the city really didnt have anything to do except bowl, skate, or go to a bar. The movie theater had closed… and turned into a church. They didn’t even get a super walmart until late in the 2000’s. I think it was 2009 or something like that.
Honestly… Berea wasn’t that bad. Poole was small and quiet but too far away from town….Morganfield was fun while it lasted… but once again… small drawback being it was far away from the bigger cities…..
But seriously…. The criteria for this list should change slightly…. it should be based on home prices, commute, school system, and ENTERTAINMENT….. unless people just dont go out anymore… they live, eat, and breathe facebook, twitter and the like.
Where is Lexington on the list? Was it not big enough?
College was the biggest waste of time in my entire life. So was marriage. I now live in the country and I’m happy living in one of the 10 worst towns in Kentucky.
I’m perfectly happy in my little town of Irvine. Oh, by the way, I have a college degree, that is not the key to my happiness. I have a job that it takes five minutes to get to and that isn’t the key to my happiness. Neither does my marital status, or any of that other garbage used as criteria. I’ve traveled, lived in other cities and other countries and I’d rather be here than anywhere else, well except Hawaii. It’s warm year round there. My point is all that criteria is superficial. People need to learn to be thankful and gracious for what they do have. Who cares if you own your own home, it doesn’t make you who you are. If you’re miserable, it’s no one’s fault but your own, so stop judging the places we call home just because it has no appeal to your taste.