
Most African American cities in Illinois research summary. We used Saturday Night Science to analyze Illinois’s most recent Census data to determine the blackest cities in Illinois based on the percentage of Black residents. Here are the results of our analysis:
-
The city with the largest African American population in Illinois is East St. Louis based on the most recent Census data.
-
East St. Louis is 92.62% Black.
-
The least African American city in Illinois is Lake Bluff.
-
Lake Bluff is 0.0% Black.
-
Illinois is 13.3% Black.
-
Illinois is the 14th blackest state in the United States.
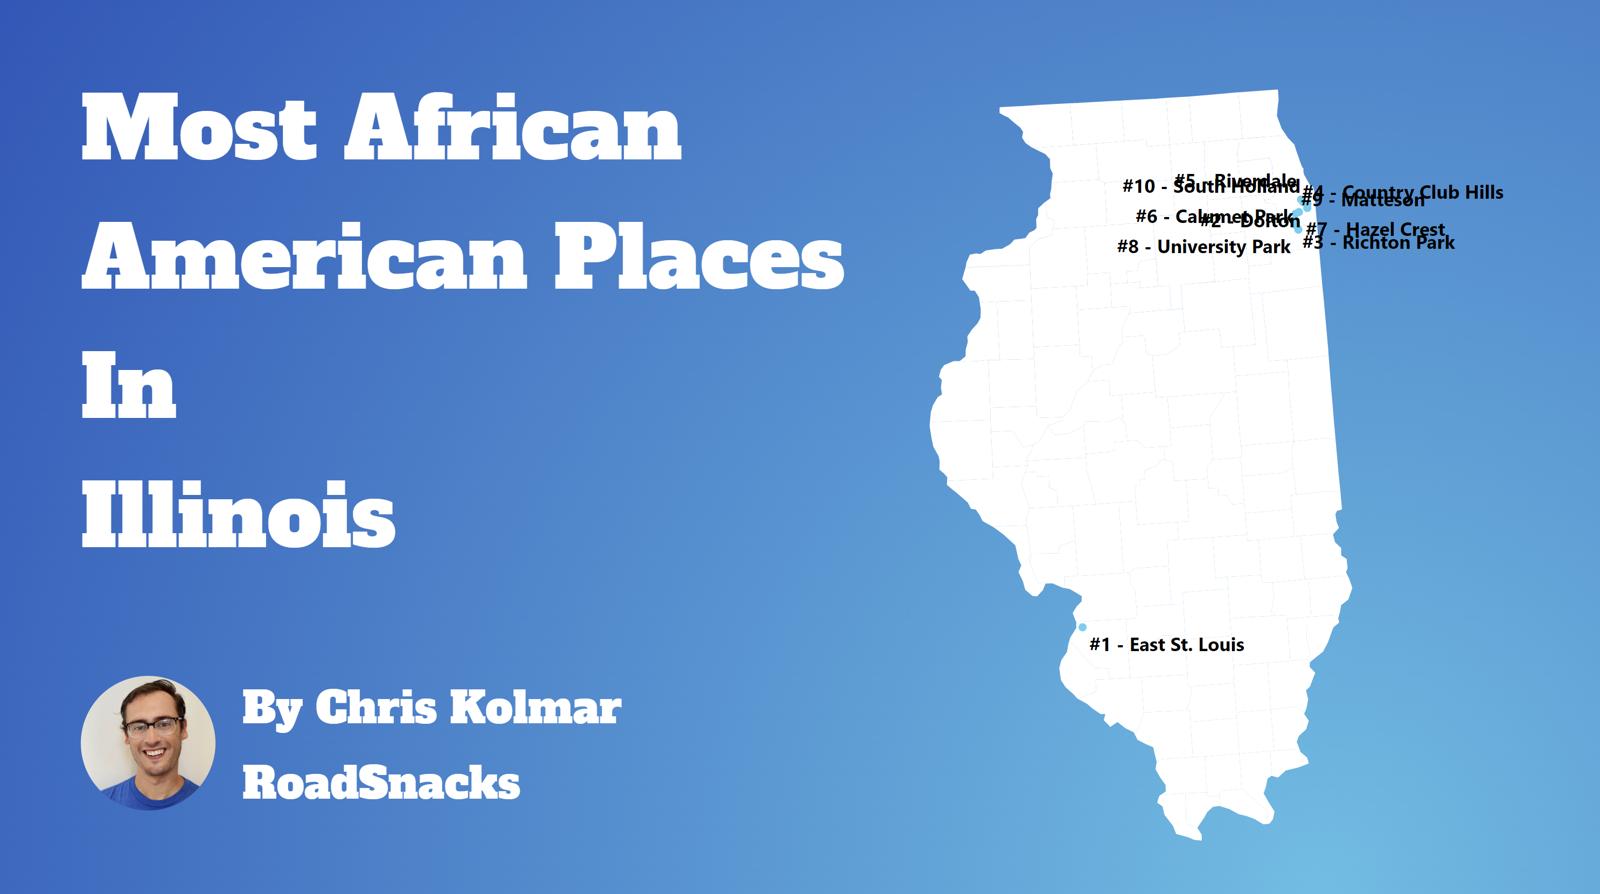
Table Of Contents: Top Ten | Methodology | Summary | Table
The Black community is one of the fastest-growing communities in America this decade.
Roughly 42 million people identifying as Black or African American live in the United States, making up 12% of the total population. According to the most recent American Community Survey, the Black population in Illinois is 1,693,169 – at 13.3% of the total population of Illinois.
The percentage growth of Blacks in America is the third largest percentage change for any race according to the Census’s race and ethnicity definition. Most scholars and historians agree that increasing diversity in America is a good thing.
We agree.
But how has the increase in the black population impacted Illinois? Which cities and towns in Illinois have seen the greatest increase in its Black population?
We broke down the most recent census data to determine the cities in Illinois with the largest African American population in 2026:
Most African American Places In Illinois
What’s the blackest city in Illinois? The city with the largest Black population in Illinois for 2026 is East St. Louis. See if East St. Louis ranked as one of the most african american places in America.
And if you already knew these places were Black, check out the best places to live in Illinois or the most diverse places in Illinois.
The 10 Blackest Cities In Illinois For 2026
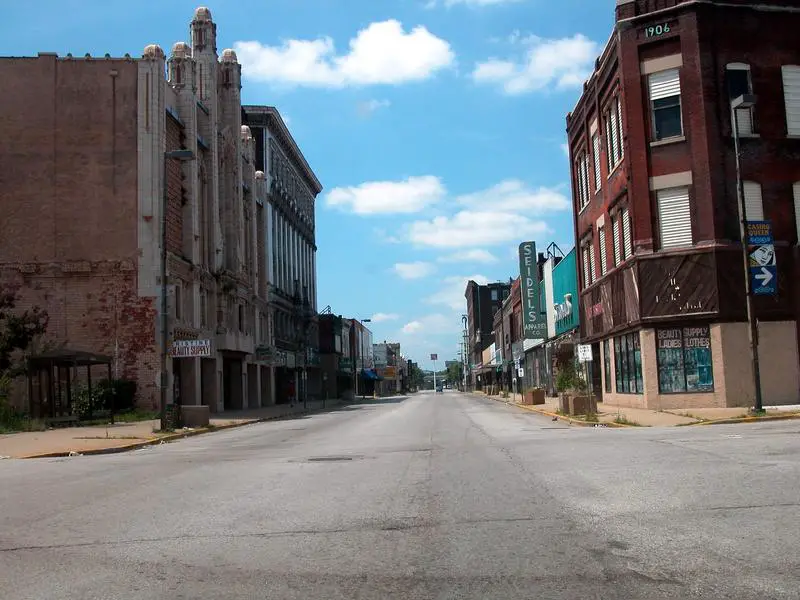
1. East St. Louis
/10
Population: 17,999
% African American: 92.62%
# Of African American Residents: 16,670
Percent Change Since 2010: -38.41%
More on East St. Louis: Data | Cost Of Living | Movers
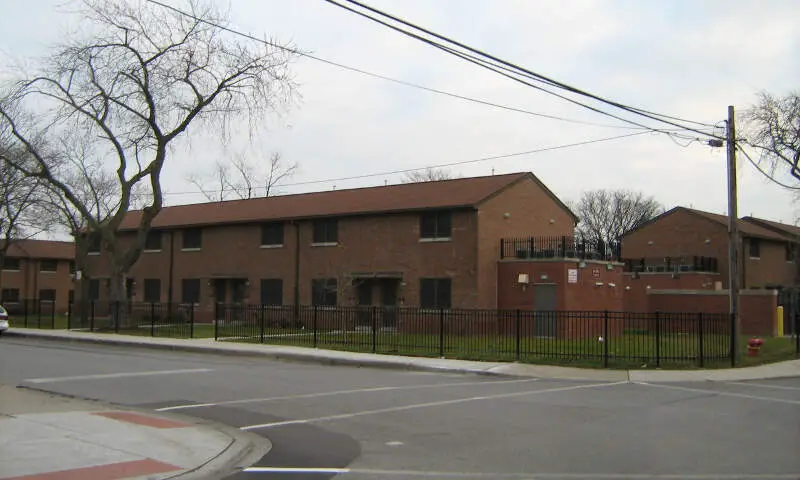
2. Riverdale
/10
Population: 10,340
% African American: 89.9%
# Of African American Residents: 9,296
Percent Change Since 2010: -27.4%
More on Riverdale: Data | Cost Of Living | Movers
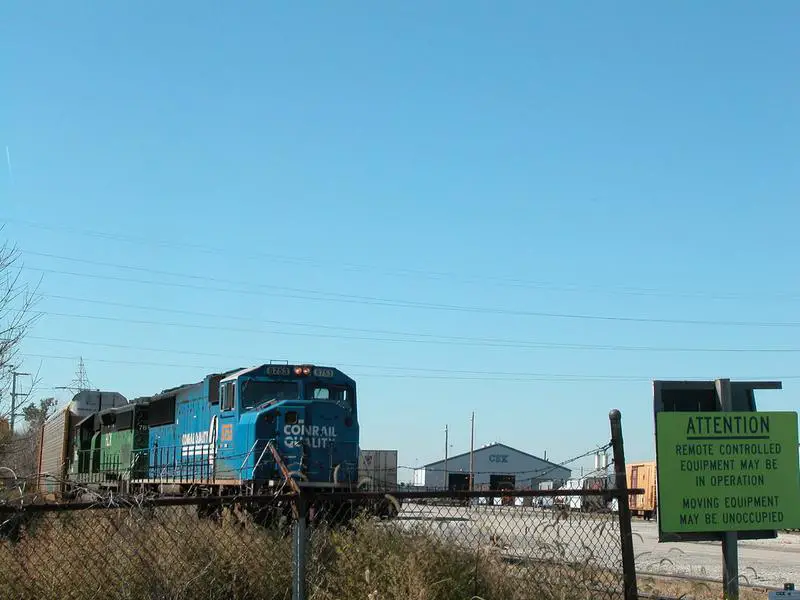
3. Dolton
/10
Population: 20,825
% African American: 89.73%
# Of African American Residents: 18,687
Percent Change Since 2010: -11.26%
More on Dolton: Data | Cost Of Living | Movers
4. Richton Park
/10
Population: 12,521
% African American: 87.6%
# Of African American Residents: 10,969
Percent Change Since 2010: 6.41%
More on Richton Park: Data | Cost Of Living | Movers
5. Country Club Hills
/10
Population: 16,324
% African American: 86.5%
# Of African American Residents: 14,120
Percent Change Since 2010: -0.04%
More on Country Club Hills: Data | Cost Of Living | Movers
6. Hazel Crest
/10
Population: 13,792
% African American: 84.56%
# Of African American Residents: 11,662
Percent Change Since 2010: -2.53%
More on Hazel Crest: Data | Cost Of Living | Movers
7. University Park
/10
Population: 7,306
% African American: 81.75%
# Of African American Residents: 5,973
Percent Change Since 2010: -4.96%
More on University Park: Data | Cost Of Living | Movers
8. Matteson
/10
Population: 18,645
% African American: 79.77%
# Of African American Residents: 14,873
Percent Change Since 2010: 8.03%
More on Matteson: Data | Cost Of Living | Movers
9. Calumet Park
/10
Population: 6,855
% African American: 76.97%
# Of African American Residents: 5,276
Percent Change Since 2010: -18.69%
More on Calumet Park: Data | Cost Of Living | Movers
10. Calumet City
/10
Population: 35,100
% African American: 75.07%
# Of African American Residents: 26,350
Percent Change Since 2010: 3.21%
More on Calumet City: Data | Cost Of Living | Movers
Methodology: How We Determined The Cities In Illinois With The Largest Black Population For 2026
We still believe in the accuracy of data — especially from the Census. So that’s where we went to get the race breakdown across Illinois.
That leads us to the Census’s most recently available data, the 2020-2024 American Community Survey data from the US Census.
Specifically, we looked at table B03002: Hispanic OR LATINO ORIGIN BY RACE. Here are the category names as defined by the Census:
- Hispanic or Latino
- White alone*
- Black or African American alone*
- American Indian and Alaska Native alone*
- Asian alone*
- Native Hawaiian and Other Pacific Islander alone*
- Some other race alone*
- Two or more races*
Our particular column of interest was the number of people who identified as Black or African American.
We limited our analysis to non-CDPs with a population greater than 5,000 people in Illinois. That left us with 324 cities.
We then calculated the percentage of residents that are Black or African American. The percentages ranked from 92.6% to 0.0%.
Finally, we ranked each city based on the percentage of the Black population, with a higher score being more Black than a lower score. East St. Louis took the distinction of being the most Black, while Lake Bluff was the least African American city.
We updated this article for 2026. This is our eleventh time ranking the cities in Illinois with the largest African American population.
Read on for more information on how the cities in Illinois ranked by population of African American residents or, for a more general take on diversity in America, head over to our ranking of the most diverse cities in America.
Summary: Black Populations Across Illinois
If you’re looking for a breakdown of African American populations across Illinois according to the most recent data, this is an accurate list.
The blackest cities in Illinois are East St. Louis, Riverdale, Dolton, Richton Park, Country Club Hills, Hazel Crest, University Park, Matteson, Calumet Park, and Calumet City.
If you’re curious enough, here are the least African American places in Illinois:
- Lake Bluff
- Elburn
- Spring Grove
For more Illinois reading, check out:
African American Population By City In Illinois
| Rank | City | Population | African American Population | % African American |
|---|---|---|---|---|
| 1 | East St. Louis | 17,999 | 16,670 | 92.62% |
| 2 | Riverdale | 10,340 | 9,296 | 89.9% |
| 3 | Dolton | 20,825 | 18,687 | 89.73% |
| 4 | Richton Park | 12,521 | 10,969 | 87.6% |
| 5 | Country Club Hills | 16,324 | 14,120 | 86.5% |
| 6 | Hazel Crest | 13,792 | 11,662 | 84.56% |
| 7 | University Park | 7,306 | 5,973 | 81.75% |
| 8 | Matteson | 18,645 | 14,873 | 79.77% |
| 9 | Calumet Park | 6,855 | 5,276 | 76.97% |
| 10 | Calumet City | 35,100 | 26,350 | 75.07% |
| 11 | South Holland | 20,911 | 15,661 | 74.89% |
| 12 | Glenwood | 8,603 | 6,087 | 70.75% |
| 13 | Markham | 11,355 | 7,994 | 70.4% |
| 14 | Bellwood | 18,256 | 12,349 | 67.64% |
| 15 | Park Forest | 21,156 | 14,254 | 67.38% |
| 16 | Lynwood | 9,083 | 6,078 | 66.92% |
| 17 | Sauk Village | 9,678 | 5,992 | 61.91% |
| 18 | Flossmoor | 9,391 | 5,588 | 59.5% |
| 19 | Broadview | 7,896 | 4,695 | 59.46% |
| 20 | Maywood | 23,201 | 12,774 | 55.06% |
| 21 | Harvey | 20,230 | 10,836 | 53.56% |
| 22 | Lansing | 28,284 | 14,532 | 51.38% |
| 23 | Hillside | 8,084 | 3,920 | 48.49% |
| 24 | Homewood | 19,294 | 8,315 | 43.1% |
| 25 | Chicago Heights | 26,736 | 10,765 | 40.26% |
| 26 | Kankakee | 23,996 | 9,556 | 39.82% |
| 27 | Crete | 8,386 | 3,262 | 38.9% |
| 28 | Danville | 28,595 | 9,781 | 34.21% |
| 29 | Belleville | 41,370 | 13,457 | 32.53% |
| 30 | Blue Island | 21,741 | 6,681 | 30.73% |
| 31 | Fairview Heights | 16,745 | 4,616 | 27.57% |
| 32 | Chicago | 2,711,226 | 743,710 | 27.43% |
| 33 | Chester | 6,797 | 1,859 | 27.35% |
| 34 | Carbondale | 22,158 | 5,831 | 26.32% |
| 35 | Berkeley | 5,199 | 1,362 | 26.2% |
| 36 | Peoria | 112,169 | 28,760 | 25.64% |
| 37 | Evergreen Park | 19,420 | 4,947 | 25.47% |
| 38 | Shiloh | 14,572 | 3,551 | 24.37% |
| 39 | Alsip | 18,583 | 4,507 | 24.25% |
| 40 | Forest Park | 13,943 | 3,351 | 24.03% |
| 41 | Pinckneyville | 5,018 | 1,194 | 23.79% |
| 42 | North Chicago | 30,643 | 7,265 | 23.71% |
| 43 | Decatur | 69,815 | 16,237 | 23.26% |
| 44 | Zion | 24,600 | 5,686 | 23.11% |
| 45 | Steger | 9,418 | 2,108 | 22.38% |
| 46 | East Moline | 20,904 | 4,314 | 20.64% |
| 47 | Westchester | 16,436 | 3,294 | 20.04% |
| 48 | Swansea | 14,710 | 2,827 | 19.22% |
| 49 | Rockford | 147,521 | 28,272 | 19.16% |
| 50 | Alton | 25,279 | 4,842 | 19.15% |
| 51 | Springfield | 113,330 | 21,697 | 19.14% |
| 52 | Urbana | 39,341 | 7,339 | 18.65% |
| 53 | Rantoul | 12,421 | 2,218 | 17.86% |
| 54 | Oak Park | 53,292 | 9,504 | 17.83% |
| 55 | Bolingbrook | 74,096 | 13,136 | 17.73% |
| 56 | Champaign | 89,996 | 15,455 | 17.17% |
| 57 | Justice | 12,324 | 2,106 | 17.09% |
| 58 | Waukegan | 89,076 | 14,749 | 16.56% |
| 59 | O’fallon | 32,262 | 5,335 | 16.54% |
| 60 | Crestwood | 10,579 | 1,725 | 16.31% |
| 61 | Collinsville | 24,031 | 3,858 | 16.05% |
| 62 | Joliet | 150,445 | 24,069 | 16.0% |
| 63 | Murphysboro | 6,735 | 1,055 | 15.66% |
| 64 | Rock Island | 36,151 | 5,643 | 15.61% |
| 65 | Posen | 5,292 | 823 | 15.55% |
| 66 | Crest Hill | 20,628 | 3,092 | 14.99% |
| 67 | Freeport | 23,505 | 3,424 | 14.57% |
| 68 | Romeoville | 41,152 | 5,865 | 14.25% |
| 69 | Evanston | 76,340 | 10,830 | 14.19% |
| 70 | Dekalb | 40,443 | 5,587 | 13.81% |
| 71 | Galesburg | 29,481 | 3,780 | 12.82% |
| 72 | Hillsboro | 5,803 | 735 | 12.67% |
| 73 | Greenville | 7,235 | 892 | 12.33% |
| 74 | Mount Vernon | 14,090 | 1,545 | 10.97% |
| 75 | Beach Park | 14,115 | 1,533 | 10.86% |
| 76 | Normal | 53,569 | 5,794 | 10.82% |
| 77 | Aurora | 179,898 | 19,271 | 10.71% |
| 78 | Moline | 42,197 | 4,439 | 10.52% |
| 79 | Woodridge | 33,941 | 3,565 | 10.5% |
| 80 | Bloomington | 78,907 | 8,073 | 10.23% |
| 81 | Frankfort | 20,651 | 2,098 | 10.16% |
| 82 | Oswego | 36,375 | 3,689 | 10.14% |
| 83 | Dixon | 14,910 | 1,507 | 10.11% |
| 84 | Glendale Heights | 32,808 | 3,269 | 9.96% |
| 85 | Skokie | 66,219 | 6,592 | 9.95% |
| 86 | Vandalia | 5,796 | 568 | 9.8% |
| 87 | Macomb | 14,894 | 1,409 | 9.46% |
| 88 | Chicago Ridge | 14,099 | 1,329 | 9.43% |
| 89 | Midlothian | 13,948 | 1,304 | 9.35% |
| 90 | Bourbonnais | 18,078 | 1,679 | 9.29% |
| 91 | Glen Carbon | 13,977 | 1,297 | 9.28% |
| 92 | Pontiac | 11,294 | 1,038 | 9.19% |
| 93 | Plainfield | 46,708 | 4,220 | 9.03% |
| 94 | Granite City | 26,549 | 2,369 | 8.92% |
| 95 | Robinson | 7,084 | 615 | 8.68% |
| 96 | Oak Lawn | 56,861 | 4,916 | 8.65% |
| 97 | Grayslake | 20,929 | 1,784 | 8.52% |
| 98 | North Riverside | 7,249 | 613 | 8.46% |
| 99 | Pontoon Beach | 6,025 | 508 | 8.43% |
| 100 | North Aurora | 18,696 | 1,560 | 8.34% |