Most Asian states in the United States research summary. We used Saturday Night Science to research the states with the highest percentage of Asian residents for 2024. The data comes from the American Community Survey 2018-2022 vintage, which breaks down race by origin.
-
The state with the highest percentage of Asian Americans is Hawaii. 36.49% of people in Hawaii are Asian.
-
The state with the lowest percentage of Asian Americans is West Virginia. 0.75% of people in West Virginia are Asian.
-
The state with the most Asian Americans is California. 5,861,649 people in California are Asian.
-
The state with the fewest Asian Americans is Wyoming. 4,551 people in Wyoming are Asian.
-
The United States has 18,873,442 Asian Americans and is 5.70% Asian.
-
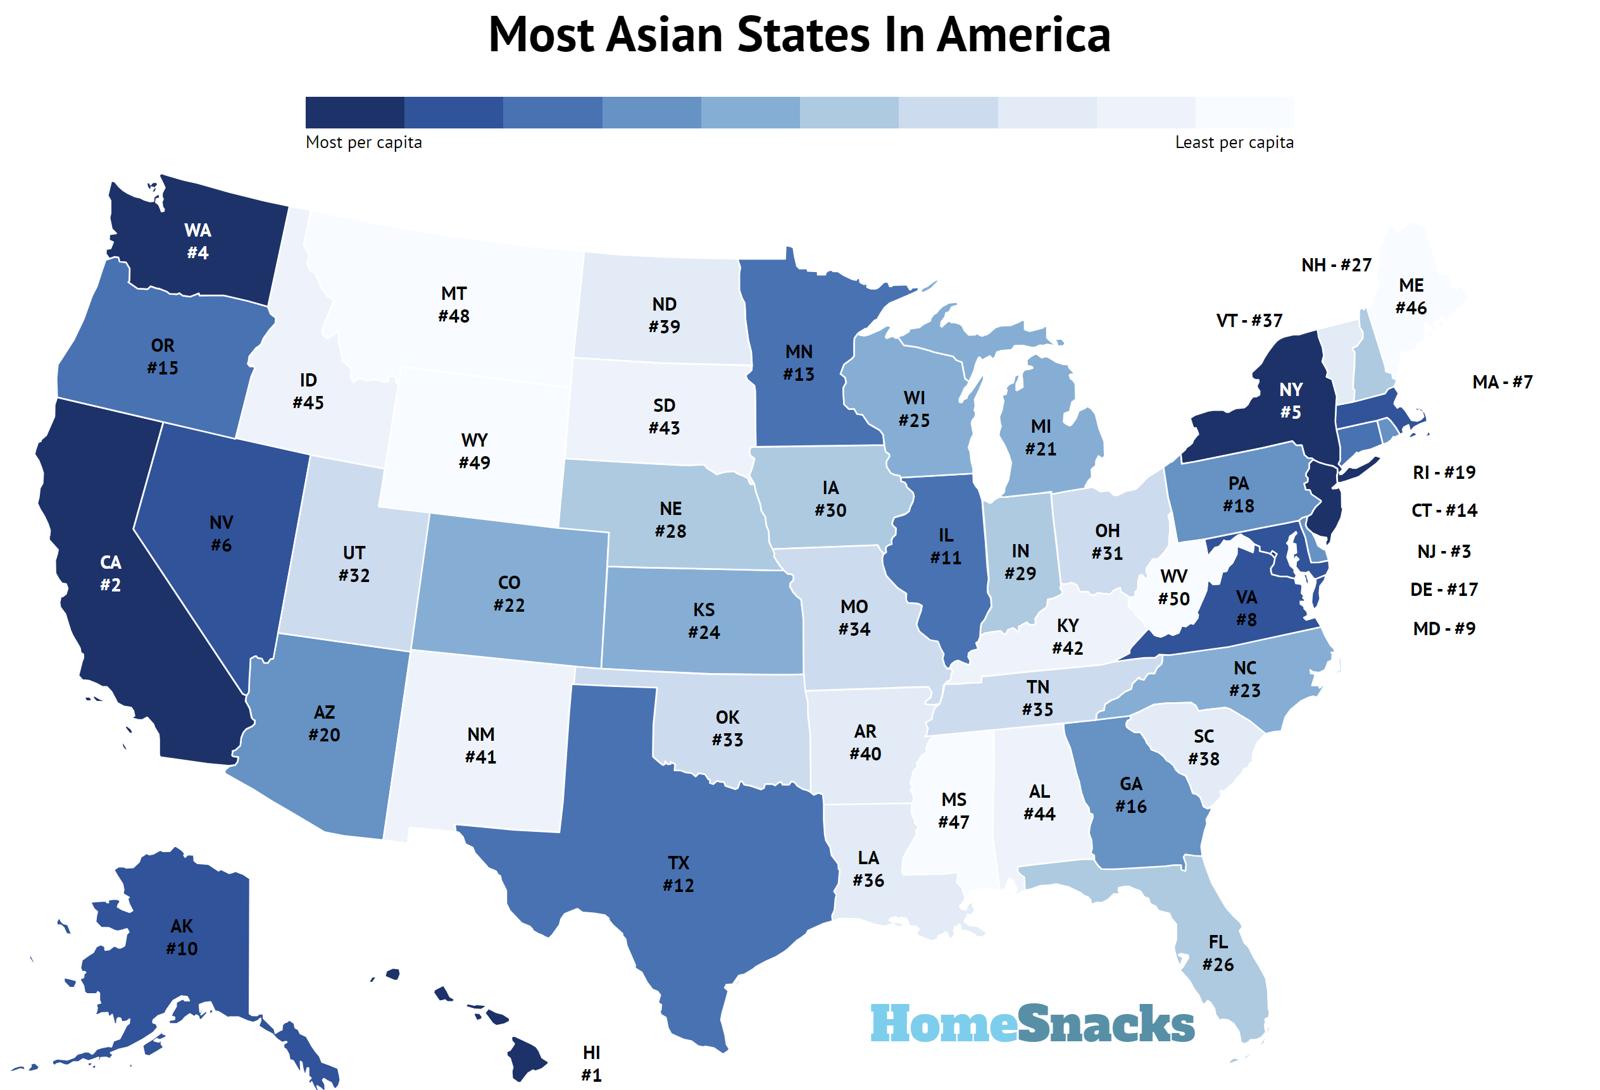
The most Asian states in the United States are Hawaii, California, New Jersey, Washington, New York, Nevada, Massachusetts, Virginia, Maryland, and Alaska.
Table Of Contents: Top Ten | Methodology | Summary | Table
Today, we will look at the most Asian states in America.
The Asian population makes up about 5.70% of the total US population, and their percentage of the US population has increased since the 1980s. Asians started immigrating in large numbers during the 19th century. However, US laws largely curtailed Asian immigration until the 1940s.
After the US changed its immigration laws to make entry easier, a new wave of immigration from Asia began.
The Census determines Asian countries such as China, Japan, Korea, and the Pacific Islands like Tonga, Samoa, and Fiji. The Census considers India to be South Asia.
Let’s look at the US states with the largest Asian populations.
The Top 10 States By percentage of Asian Americans for 2024:
Asia is the most populous continent, with its inhabitants accounting for 60% of the world’s population. The world’s two most populated countries, China and India, comprise 36% of the world’s population.
Okay, we’re all set to explore America’s most Asian states.
For exactly how we calculated these rankings, read on. Or, if you’re interested in reading something else, check out:
10. Alaska
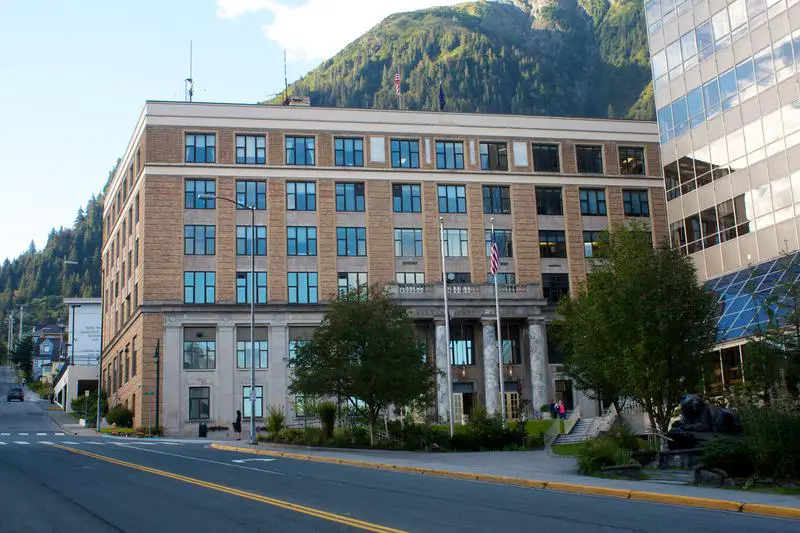
Population: 734,821
Percent Asian: 6.3%
Percent Asian 2010: 5.1%
Percent Change: 31.4%
More On Alaska: Biggest Cities | Average Rent
We begin our tour of the most Asian states in America in Alaska. In Alaska, the Asian population is 6.3% – and Alaska has the 6th fastest growing Asian population in the USA.
In comparison, West Virginia is 0.75% Asian. There are only 7,262 Asians in the whole state of Montana. In Wyoming, the Asian population is only .75%, but only 842 Asian Americans moved to Wyoming in the last ten years.
Kodiak has by far the largest Asian population at 35%. Ketchikan is 12% Asian, and Anchorage is 9% Asian. In some parts of Anchorage, sushi is as omnipresent as pizza. There are more Pacific Islanders per capita in Anchorage than in any other county in the U.S., except in Hawaii.
Asians came to Alaska in the late 1700s to help with fishing jobs and to work in Alaskan gold mines. Today, Filipinos represent 54% of Alaska’s total Asian population and are 2.7% of Alaska’s total population.
9. Maryland
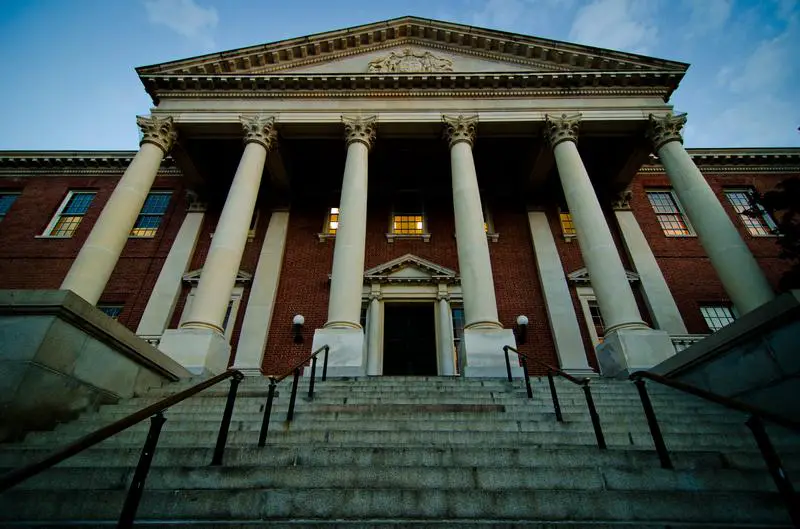
Population: 6,161,707
Percent Asian: 6.4%
Percent Asian 2010: 5.3%
Percent Change: 31.3%
More On Maryland: Biggest Cities | Average Rent
Moving on, we come to the next most Asian state in America, Maryland. In Maryland, the Asian population is 6.4%, growing by about .1% each year.
DC suburb Rockville has a 20% Asian population. College Park, home to the University of Maryland, is 15% Asian.
I couldn’t find any notable Asians born in Maryland, but famous Asians who may have been to Maryland at some point may include Xu Xin, Wayne Liqin, and Fan Zhengdong.
8. Virginia
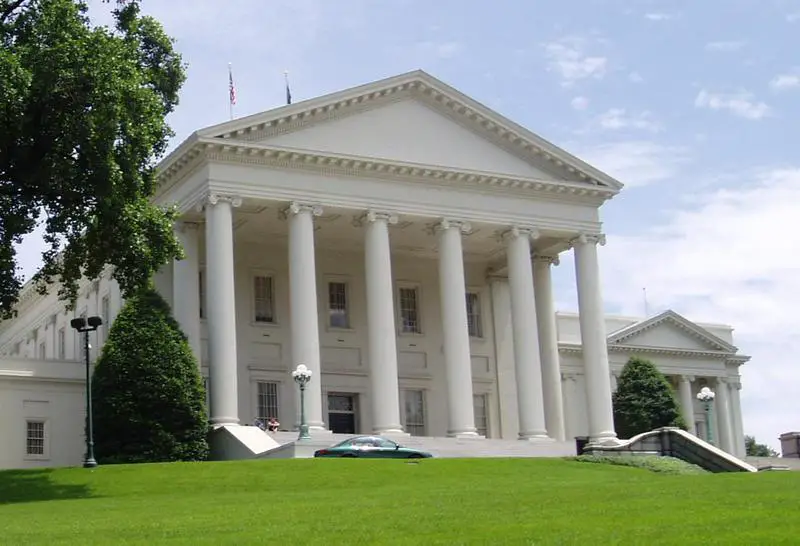
Population: 8,624,511
Percent Asian: 6.8%
Percent Asian 2010: 5.3%
Percent Change: 41.8%
More On Virginia: Biggest Cities | Average Rent
Moving on, we come to our next most Asian state in the US, Virginia. In Virginia, the Asian population makes up about 6.8% of the state’s demographics. The Asian population has increased by about 1% in the last ten years.
Herndon, Fairfax, and Vienna have the state’s biggest Asian populations. In these cities, the Asian population is between 17 and 14 percent. In Annandale, the Vietnamese population is 10%, which is why Virginia natives call it Asiandale.
Being so close to Washington DC, it begs the question – how many Asian politicians have made it to Congress or the Senate? There have been about 50 total, including Mazie Horino from Hawaii and Tammy Duckworth of Illinois.
Okay, so Asians aren’t necessarily breaking down the doors in DC, but it brings up another question: Which jobs do Asian Americans do the most? According to the Bureau of Labor Statistics, Asians are most likely to be in the computer sciences, as well as scientists, pharmacists, engineers, and doctors.
As such, Asians far outpace the income levels of all Americans, earning an average of $80,000 a year.
7. Massachusetts

Population: 6,984,205
Percent Asian: 6.9%
Percent Asian 2010: 5.2%
Percent Change: 44.9%
More On Massachusetts: Biggest Cities | Average Rent
Where’s our next most Asian state in America? That would be in Massachusetts. In Massachusetts, the Asian population is 6.9%, 1.1% higher than ten years ago.
Quincy, Malden, Lowell, and Cambridge have the largest Asian populations here. In Quincy, the Asian population is 28%. In Cambridge, it’s 16%.
Of course, Cambridge is home to Harvard University, the most prestigious university in the USA.
Famous Asians from Massachusetts include ping pong players Harry Guo and Wayne Ha, as well as Hello Kitty.
6. Nevada
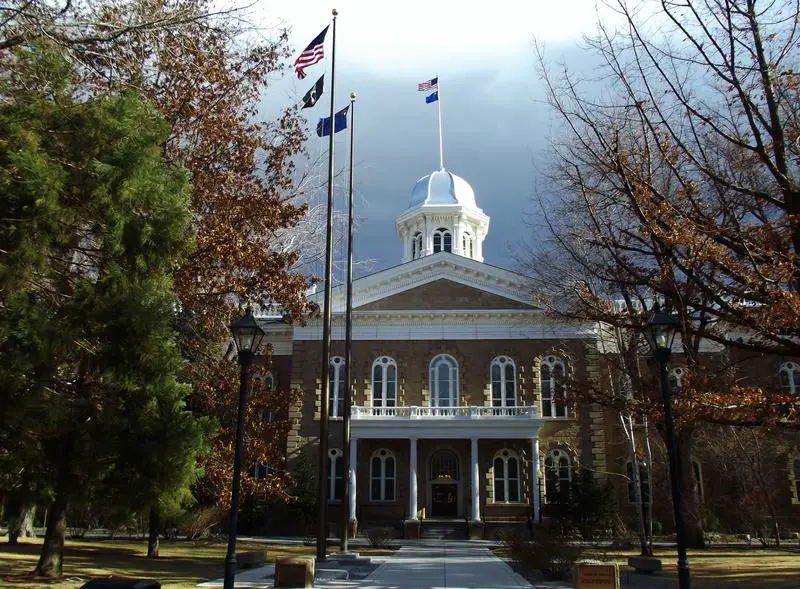
Population: 3,104,817
Percent Asian: 8.3%
Percent Asian 2010: 6.9%
Percent Change: 41.5%
More On Nevada: Biggest Cities | Average Rent
Back to the map we go, and we come to the next most Asian state in America, Nevada. In the hot and deserty landscape, the Asian population is 8.3%. The Asian population in Nevada is the 5th fastest-growing in the US.
Henderson, a Las Vegas suburb, is 8% Asian. Las Vegas is 6.5% Asian, and Reno is 6.2% Asian.
One modern stereotype is that Asians gamble more than any other race. Some of poker’s biggest stars are Asian. Indonesia’s John Juanda is the most successful, having won more than $24 million in tournaments. Taiwan native Kitty Kuo is likely the most well-known female Asian poker player.
Both live in Las Vegas.
5. New York
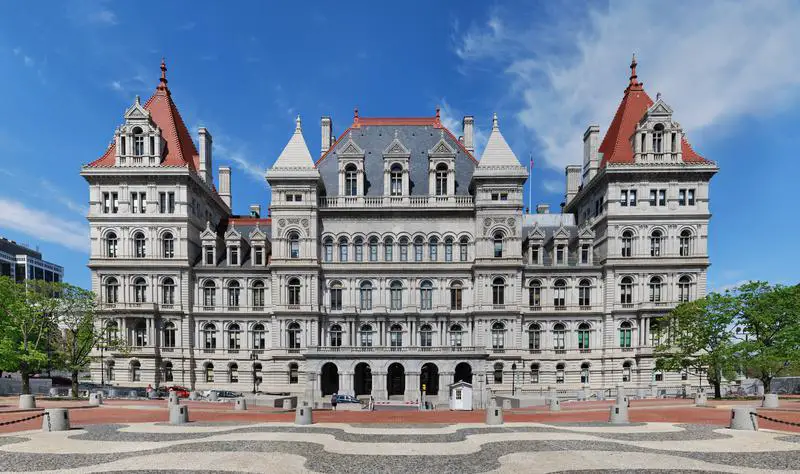
Population: 19,994,379
Percent Asian: 8.8%
Percent Asian 2010: 7.2%
Percent Change: 26.9%
More On New York: Biggest Cities | Average Rent
Let’s look up the next most Asian state in the USA, where we’ll stop in New York. Here in the Empire State, 8.28% of the population is Asian. New York’s Asian population has also increased by over a percentage point in the last ten years.
New Hyde Park is a third Asian, Manorhaven is 20% Asian, and Ithaca, New York, is 18% Asian. Two of these cities are on Long Island.
Famous Asians from New York include pool player Jeanette Lee, actress Lucy Liu, and Norah Jones. She’s Indian.
4. Washington
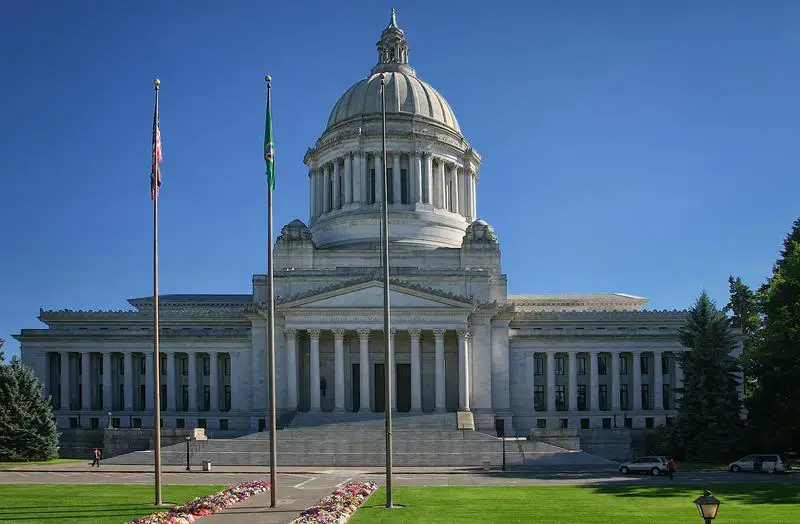
Population: 7,688,549
Percent Asian: 9.1%
Percent Asian 2010: 6.9%
Percent Change: 54.8%
More On Washington: Biggest Cities | Average Rent
Where’s our next most Asian state in America? That would be in Washington. In the evergreen state, 9.1% of the population is Asian, which is a 54.78% increase over the last ten years.
Cities with the largest Asian populations in Washington include Redmond, Bellevue, and Newcastle. In Redmond, the Asian population makes up 34% – or more than 1 in 3 residents.
A recent article credits a plentiful supply of high-tech jobs and good schools as the main reason Redmond has a high Asian population. Redmond is home to Microsoft and Nintendo, and as we saw earlier, Asians have many computer-related careers.
Seattle’s Asian population is 15%.
In fact, of Washington’s top ten most Asian cities, all have more than a 20% Asian population.
Famous Asians from Washington include actress Diana Lee, civil rights leader and human rights activist Karen Narasaki, and Pikachu.
3. New Jersey
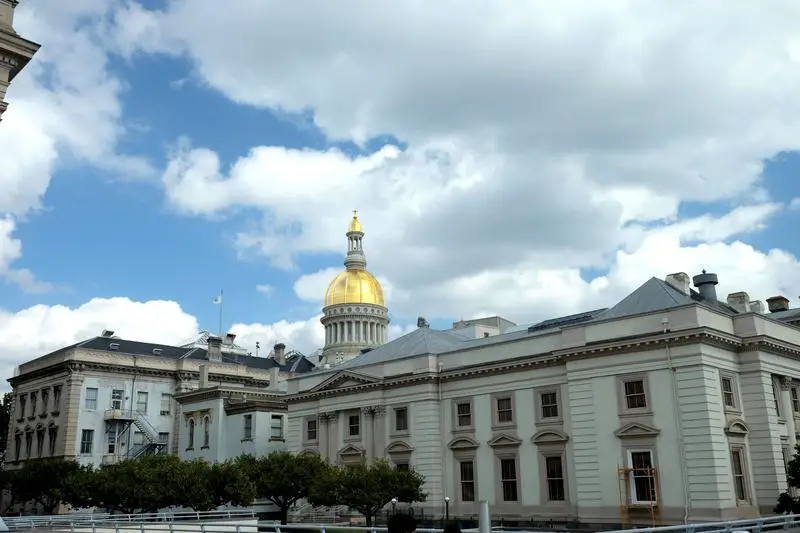
Population: 9,249,063
Percent Asian: 9.8%
Percent Asian 2010: 7.9%
Percent Change: 30.7%
More On New Jersey: Biggest Cities | Average Rent
We’re going to visit our next most Asian state in New Jersey. Right next door to New York, New Jersey has a much higher Asian population than New York, at 9.8%, and growing. Factually, New Jersey has the fastest-growing Asian population in America.
Palisades Park, Fort Lee, and Leonia all have Asian populations of over 40%. Palisades Park has a 60% Asian population. Koreatown in Palisades Park has one of the largest and fastest-growing ethnic Korean enclaves outside of Korea.
Palisades Park’s Koreatown has the highest density of ethnic Koreans in the Western Hemisphere and is the home of the highest Korean-American density of any US city.
For the last 20 years, a substantial number of Korean Americans have settled in Bergen County, New Jersey, just over the George Washington Bridge.
1 in 4 residents in Somerset County, New Jersey, are Asian.
According to the New York Times, young professionals from South Asian countries like India, Pakistan, Nepal, and Sri Lanka are becoming politically active.
2. California
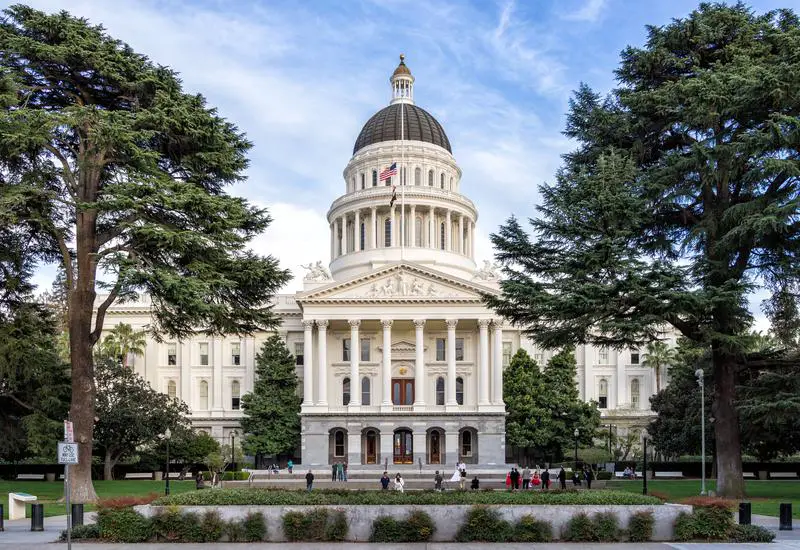
Population: 39,356,104
Percent Asian: 14.9%
Percent Asian 2010: 12.8%
Percent Change: 25.1%
More On California: Biggest Cities | Average Rent
Moving on, we come to our second most Asian state in the US – California. There is a very large jump between New Jersey and California. Here in the Golden State, the Asian population is 14% and growing.
Monterey Park, a Los Angeles suburb, is 67% Asian. Cupertino, home to Apple, is 66% Asian.
Many Los Angeles and San Francisco suburbs have Asian populations over 50%. San Francisco, home of Bruce Lee, is 33% Asian.
It’s hard to go anywhere in the greater Los Angeles and San Francisco regions without seeing Asian markets, nail salons, and, of course, food.
In our opinion, the Golden Dragon Restaurant on Broadway in Korea town has the best dim sum in the world. Well, at least in the LA area. On a Sunday, you can get dim sum, ride your bike up the hill, and catch a Dodger game.
The best baked lobster rolls in San Francisco are at Sushi Yoshizumi.
Americans were asked what their favorite Asian food dishes are. They were satay, sushi, chicken curry, Tom Yum, dim sum, and laksa.
1. Hawaii
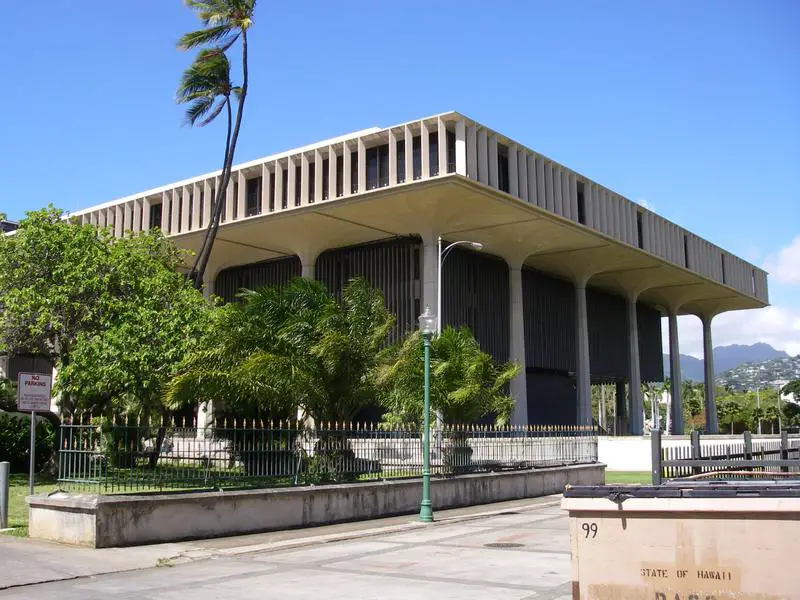
Population: 1,450,589
Percent Asian: 36.5%
Percent Asian 2010: 38.4%
Percent Change: 3.3%
More On Hawaii: Biggest Cities | Average Rent
And where is the most Asian state in America?
If you guessed Hawaii, you’re right, mister. Hawaii has more Asians than any other state – at 36.5.% Hawaii is becoming less Asian over time, as residents are leaving Hawaii and moving to places like California. Hawaii has lost 3.26% of its Asians since 2010.
Most of the larger cities in Hawaii are at least half Asian. Honolulu is 53% Asian.
Most early Asian settlers to the US went to Hawaii. Many early immigrants moved to the islands as laborers to work on the pineapple, coconut, and sugarcane plantations. A few years back, Filipinos passed Japanese residents to become the largest Asian population in Hawaii.
Of course, Hawaii is about halfway between the US and Asia.
Hawaii is known for surfing. Are there any famous Asian surfers to come out of Hawaii? Yes, there are: Duke Kahanamoku was born in Hawaii and is supposedly the 7th most famous surfer ever.
How We Determined The Most Asian States in The US
When we analyze what it’s like to live in a state, we simply look at statistics. In particular, we use Saturday Night Science to analyze the recently released 2018-2022 American Community Survey for a detailed breakdown of race by state.
Specifically, we looked at table B03002, which has the breakdown of people by Hispanic/Latino and race.
We looked at the percentage of the population of each state that identified as non-Hispanic/Latino, Asian.
We then ranked each city from 1 to 50 in terms of that percentage, with the state having the highest overall percentage being named the “State In America with the Largest Asian population” — Hawaii. We updated this article for 2024. This report is our time ranking the most Asian states in America.
What is the “least Asian” state according to the data? That would be West Virginia.
There You Have It — The States With The Largest Asian Populations in the US
Okay, so that’s it – our most Asian states in America.
Hopefully you learned something today like I did.
And we’ll guess that Hawaii is still the most asian state for the next several years.
Here’s a quick look at the least Asian states on the list:
- West Virginia
- Wyoming
- Montana
For more reading, check out:
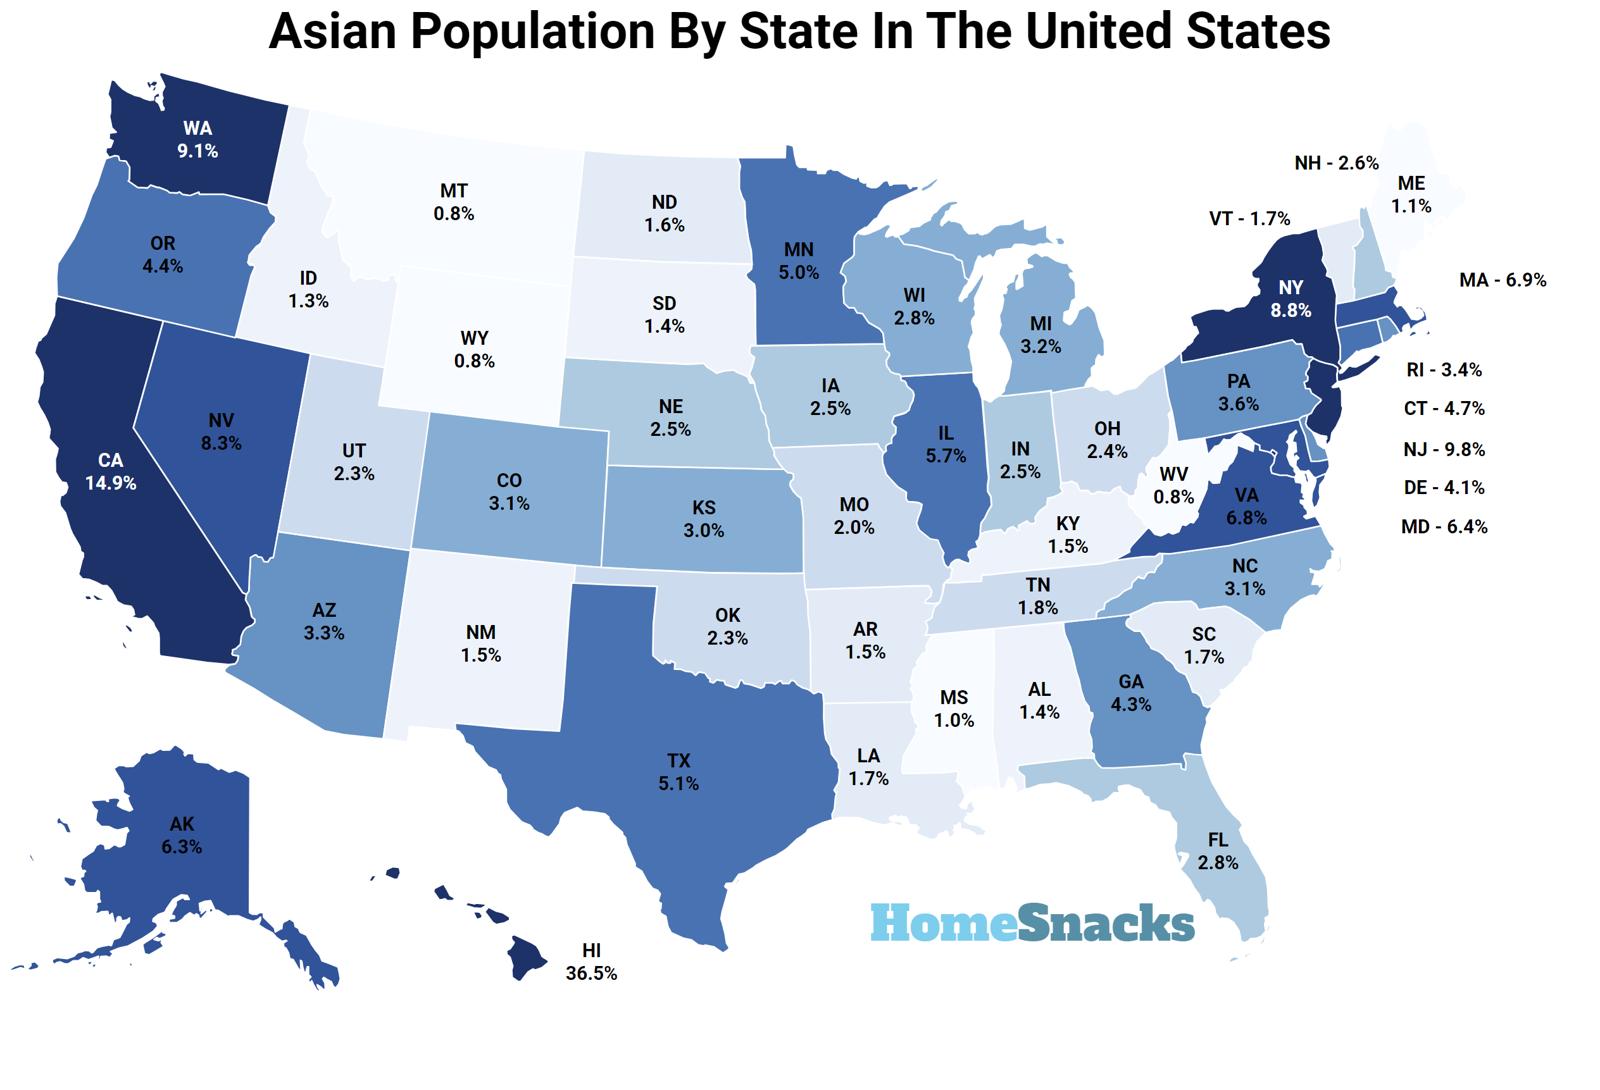
Asian Population By State In The United States For 2024
| Rank | State | Population | Asian Population | % Asian |
|---|---|---|---|---|
| 1 | Hawaii | 1,450,589 | 529,361 | 36.5% |
| 2 | California | 39,356,104 | 5,861,649 | 14.9% |
| 3 | New Jersey | 9,249,063 | 905,752 | 9.8% |
| 4 | Washington | 7,688,549 | 702,336 | 9.1% |
| 5 | New York | 19,994,379 | 1,752,744 | 8.8% |
| 6 | Nevada | 3,104,817 | 256,661 | 8.3% |
| 7 | Massachusetts | 6,984,205 | 484,291 | 6.9% |
| 8 | Virginia | 8,624,511 | 586,554 | 6.8% |
| 9 | Maryland | 6,161,707 | 396,983 | 6.4% |
| 10 | Alaska | 734,821 | 46,507 | 6.3% |
| 11 | Illinois | 12,757,634 | 731,197 | 5.7% |
| 12 | Texas | 29,243,342 | 1,487,200 | 5.1% |
| 13 | Minnesota | 5,695,292 | 284,384 | 5.0% |
| 14 | Connecticut | 3,611,317 | 169,549 | 4.7% |
| 15 | Oregon | 4,229,374 | 185,149 | 4.4% |
| 16 | Georgia | 10,722,325 | 461,195 | 4.3% |
| 17 | Delaware | 993,635 | 40,394 | 4.1% |
| 18 | Pennsylvania | 12,989,208 | 469,434 | 3.6% |
| 19 | Rhode Island | 1,094,250 | 37,177 | 3.4% |
| 20 | Arizona | 7,172,282 | 233,864 | 3.3% |
| 21 | Michigan | 10,057,921 | 325,464 | 3.2% |
| 22 | Colorado | 5,770,790 | 181,338 | 3.1% |
| 23 | North Carolina | 10,470,214 | 322,895 | 3.1% |
| 24 | Kansas | 2,935,922 | 87,010 | 3.0% |
| 25 | Wisconsin | 5,882,128 | 167,512 | 2.8% |
| 26 | Florida | 21,634,529 | 596,828 | 2.8% |
| 27 | New Hampshire | 1,379,610 | 36,232 | 2.6% |
| 28 | Nebraska | 1,958,939 | 48,446 | 2.5% |
| 29 | Indiana | 6,784,403 | 167,597 | 2.5% |
| 30 | Iowa | 3,188,836 | 78,241 | 2.5% |
| 31 | Ohio | 11,774,683 | 281,238 | 2.4% |
| 32 | Utah | 3,283,809 | 76,283 | 2.3% |
| 33 | Oklahoma | 3,970,497 | 90,666 | 2.3% |
| 34 | Missouri | 6,154,422 | 125,882 | 2.0% |
| 35 | Tennessee | 6,923,772 | 127,367 | 1.8% |
| 36 | Louisiana | 4,640,546 | 79,558 | 1.7% |
| 37 | Vermont | 643,816 | 10,678 | 1.7% |
| 38 | South Carolina | 5,142,750 | 84,972 | 1.7% |
| 39 | North Dakota | 776,874 | 12,380 | 1.6% |
| 40 | Arkansas | 3,018,669 | 46,593 | 1.5% |
| 41 | New Mexico | 2,112,463 | 32,214 | 1.5% |
| 42 | Kentucky | 4,502,935 | 68,569 | 1.5% |
| 43 | South Dakota | 890,342 | 12,678 | 1.4% |
| 44 | Alabama | 5,028,092 | 69,099 | 1.4% |
| 45 | Idaho | 1,854,109 | 24,189 | 1.3% |
| 46 | Maine | 1,366,949 | 14,944 | 1.1% |
| 47 | Mississippi | 2,958,846 | 28,663 | 1.0% |
| 48 | Montana | 1,091,840 | 9,002 | 0.8% |
| 49 | Wyoming | 577,929 | 4,551 | 0.8% |
| 50 | West Virginia | 1,792,967 | 13,460 | 0.8% |

Hey Chris,
Thanks for this informative article. Just a quick correction from a LA native: “It’s the opinion of this channel that the Golden Dragon Restaurant on Broadway in *Korea* town has the best dim sum in the whole world.” The GD restaurant is actually in Chinatown. Although officially known as the original Chinatown, this area has become gentrified in the past decade and most Chinese (and other Asians, namely Southeast Asians that have shared this part of LA City) have moved to the San Gabriel valley like Monterey Park as you’ve mentioned, and also Alhambra, Arcadia, Walnut, Hacienda Heights, Chino Hills and further east as real estate has become scarce and expensive inland.