Do you live in one of the most miserable places in Indiana?
Only a third of Hoosiers say they are truly happy. That’s too bad, considering that folks in Indiana don’t really have it too bad in the grand scheme of things.
But, we were curious – which Indiana cities might be the most miserable? We’re about to find out, using Saturday Night Science and data.
After analyzing the 124 largest cities, we sadly present the most miserable cities in the Hoosier State.
Table Of Contents: Top Ten | Methodology | Summary | Table
The 10 Most Miserable Places In Indiana
Read on below to see how we crunched the numbers and how your town ranked. If you have a smile on your face, you probably don’t live in one of these cities.
Oh, and by the way, West Lafayette is the happiest place in Indiana.
For more Indiana reading, check out:
The 10 Most Miserable Places In Indiana For 2023
/10
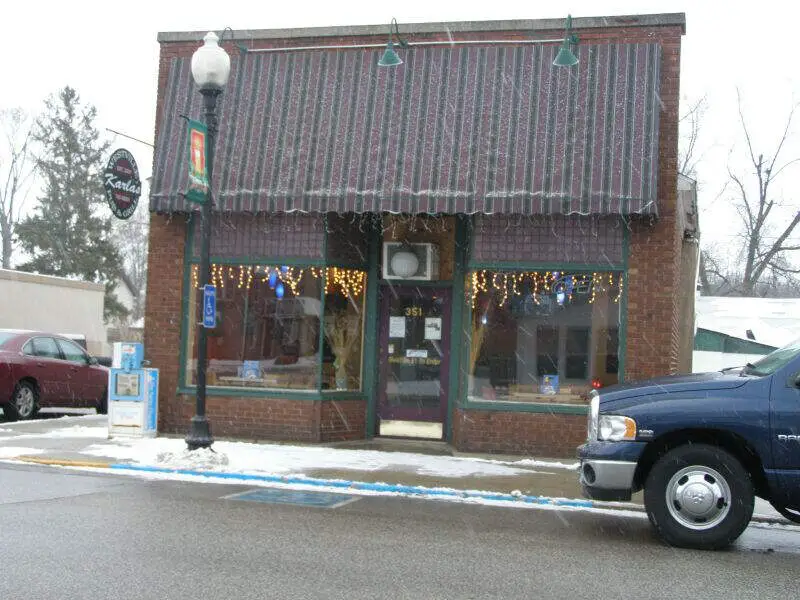
Population: 6,062
Poverty Level: 8.8%
Median Home Price $129,400
Married Households 17.0%
Households With Kids 36.95%
More on Westville: Data | Crime | Cost Of Living
/10
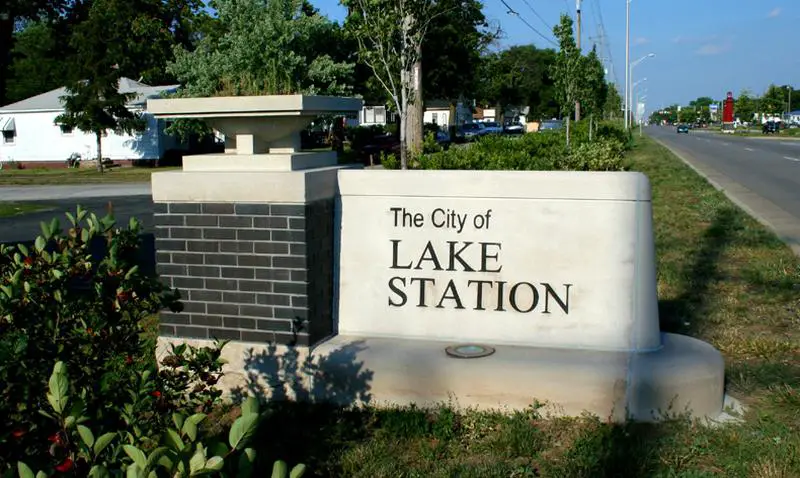
Population: 13,292
Poverty Level: 18.1%
Median Home Price $88,700
Married Households 19.0%
Households With Kids 31.07%
More on Lake Station: Data | Cost Of Living
/10
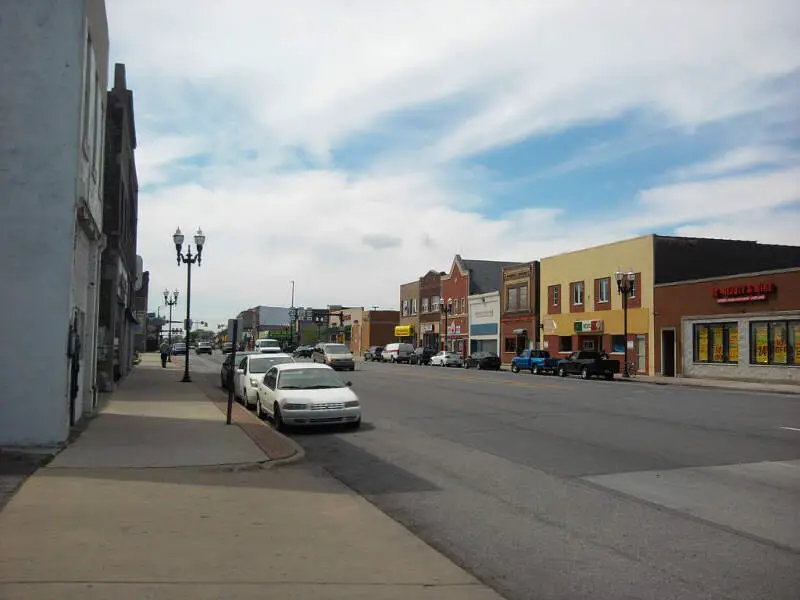
Population: 26,502
Poverty Level: 27.8%
Median Home Price $76,200
Married Households 12.0%
Households With Kids 36.27%
More on East Chicago: Data | Crime | Cost Of Living
/10
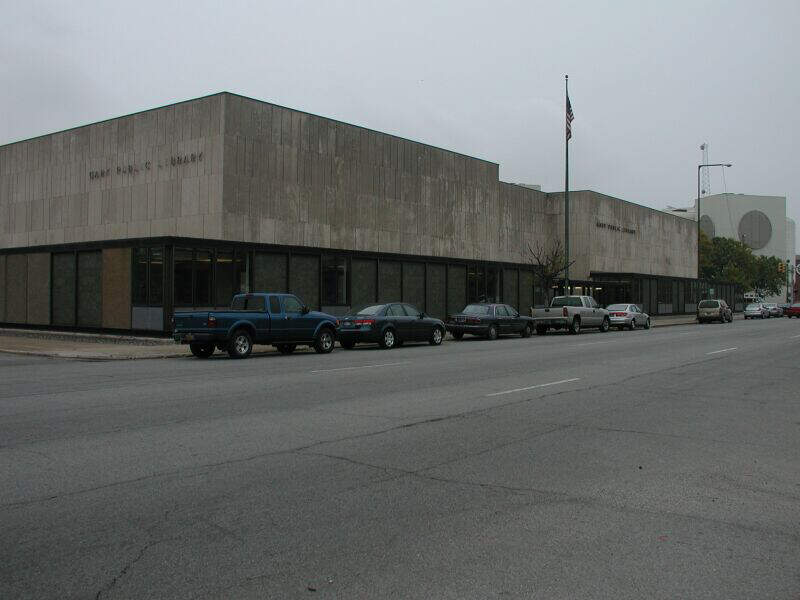
Population: 69,739
Poverty Level: 32.0%
Median Home Price $70,600
Married Households 12.0%
Households With Kids 31.16%
More on Gary: Data | Crime | Cost Of Living
/10
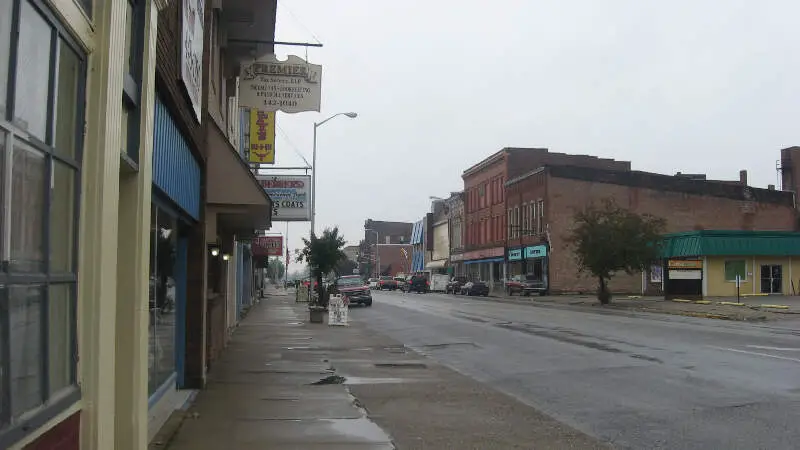
Population: 8,320
Poverty Level: 14.6%
Median Home Price $88,200
Married Households 34.0%
Households With Kids 34.62%
More on Brazil: Data | Cost Of Living
/10
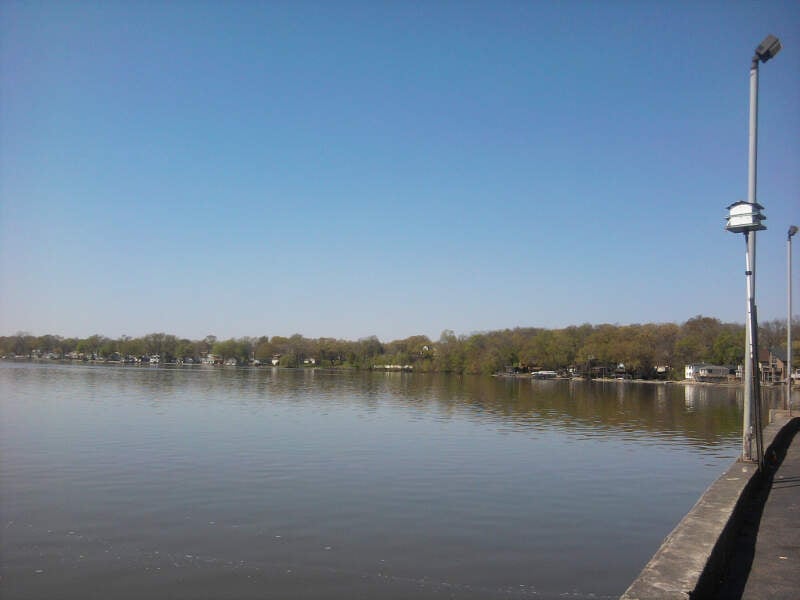
Population: 13,725
Poverty Level: 4.9%
Median Home Price $206,400
Married Households 22.0%
Households With Kids 31.49%
More on Cedar Lake: Data | Crime | Cost Of Living
/10
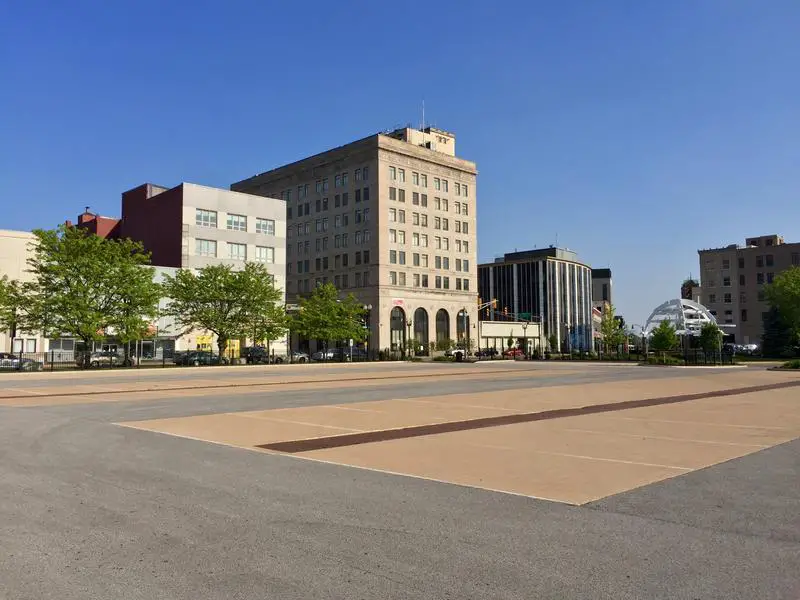
Population: 77,491
Poverty Level: 21.2%
Median Home Price $107,500
Married Households 15.0%
Households With Kids 32.34%
More on Hammond: Data | Crime | Cost Of Living
/10
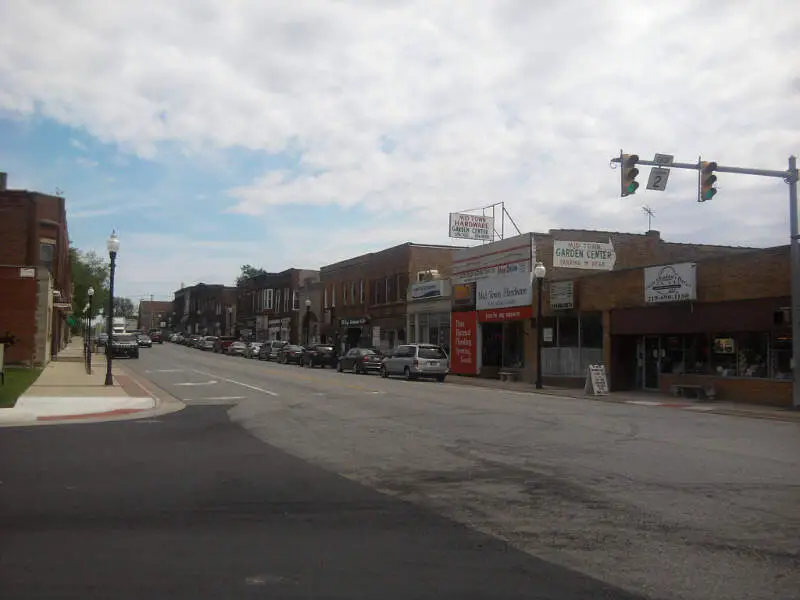
Population: 10,569
Poverty Level: 4.3%
Median Home Price $183,500
Married Households 31.0%
Households With Kids 39.2%
More on Lowell: Data | Crime | Cost Of Living
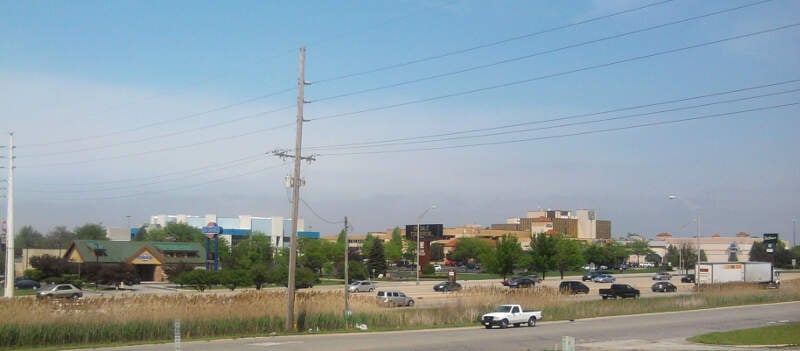
/10
Population: 36,196
Poverty Level: 13.1%
Median Home Price $151,800
Married Households 17.0%
Households With Kids 29.9%
More on Merrillville: Data | Crime | Cost Of Living
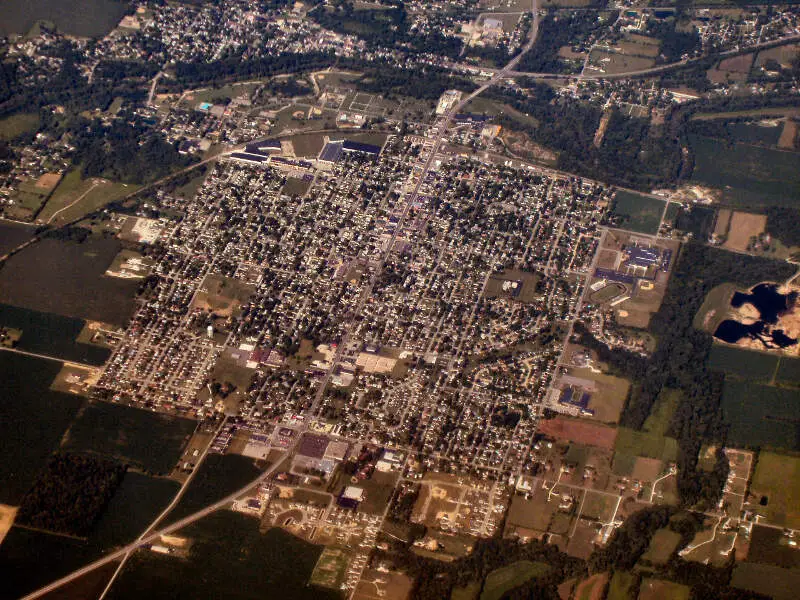
/10
Population: 6,088
Poverty Level: 13.9%
Median Home Price $100,900
Married Households 39.0%
Households With Kids 38.87%
More on Gas City: Data | Cost Of Living
Methodology: How We Measured The Most Miserable Cities In The Hoosier State
To rank the unhappiest places in Indiana, we had to determine what criteria make people happy. It isn’t a stretch to assume that happy people earn great salaries, are relatively stress-free, and have a stable home life.
So we went to the Census’s American Community Survey 2017-2021 report for the happy criteria, flipped the list with Saturday Night Science, and it spit out the answer.
Like magic.
Here are the criteria we used to measure misery:
- Percentage of residents with a college degree
- Average commute times
- Unemployment rates
- Cost of living
- % of married couples
- % of families with kids
- Poverty rate
After we decided on the criteria, we gathered the data for the 124 places in Indiana with over 5,000 people.
We then ranked each place from one to 124 for each of the seven criteria, with a score of one being the most miserable (Any ties were given to the larger place).
Next, we averaged the seven rankings into a Miserable Index for each place with the lowest overall Miserable Index “earning” the title “Most Miserable City In Indiana.”
If you’d like to see the complete list of states, most miserable to happiest, scroll to the bottom of this post to see the unabridged chart.
We updated this article for 2023, and it’s our tenth time ranking the most miserable cities in Indiana.
There You Have It – The Least Happy Cities In Indiana
As we said earlier, trying to determine the most miserable cities in Indiana is usually a subjective matter.
But if you’re analyzing cities where people are not stable, where you’re stuck in traffic, and no one spent the time to go to college, then this is an accurate list.
If you’re curious enough, here are the happiest cities in Indiana, according to science:
- West Lafayette
- Jasper
- Bloomington
For more Indiana reading, check out:
- Best Places To Live In Indiana
- Cheapest Places To Live In Indiana
- Most Dangerous Cities In Indiana
- Richest Cities In Indiana
- Safest Places In Indiana
- Worst Places To Live In Indiana
- Most Expensive Places To Live In Indiana
Miserable Cities In Indiana For 2023
| Rank | City | Population | Poverty Level | Median Home Value | % Married | % Kids |
|---|---|---|---|---|---|---|
| 1 | Westville, IN | 6,062 | 8.8% | $129,400 | 17.0% | 36.95% |
| 2 | Lake Station, IN | 13,292 | 18.1% | $88,700 | 19.0% | 31.07% |
| 3 | East Chicago, IN | 26,502 | 27.8% | $76,200 | 12.0% | 36.27% |
| 4 | Gary, IN | 69,739 | 32.0% | $70,600 | 12.0% | 31.16% |
| 5 | Brazil, IN | 8,320 | 14.6% | $88,200 | 34.0% | 34.62% |
| 6 | Cedar Lake, IN | 13,725 | 4.9% | $206,400 | 22.0% | 31.49% |
| 7 | Hammond, IN | 77,491 | 21.2% | $107,500 | 15.0% | 32.34% |
| 8 | Lowell, IN | 10,569 | 4.3% | $183,500 | 31.0% | 39.2% |
| 9 | Merrillville, IN | 36,196 | 13.1% | $151,800 | 17.0% | 29.9% |
| 10 | Gas City, IN | 6,088 | 13.9% | $100,900 | 39.0% | 38.87% |
| 11 | Kendallville, IN | 9,926 | 7.5% | $103,200 | 25.0% | 28.65% |
| 12 | Portage, IN | 37,540 | 13.8% | $164,600 | 27.0% | 34.22% |
| 13 | Sellersburg, IN | 9,686 | 4.5% | $168,400 | 22.0% | 34.57% |
| 14 | Logansport, IN | 18,471 | 17.3% | $68,500 | 20.0% | 32.55% |
| 15 | Alexandria, IN | 5,120 | 15.3% | $78,900 | 39.0% | 32.24% |
| 16 | Martinsville, IN | 11,848 | 11.7% | $119,100 | 36.0% | 32.75% |
| 17 | Monticello, IN | 5,508 | 5.9% | $99,800 | 23.0% | 25.85% |
| 18 | Plymouth, IN | 10,209 | 18.6% | $99,500 | 22.0% | 37.85% |
| 19 | Elkhart, IN | 53,838 | 19.6% | $100,700 | 17.0% | 31.91% |
| 20 | Griffith, IN | 16,213 | 8.2% | $155,100 | 24.0% | 31.8% |
| 21 | Winfield, IN | 6,924 | 2.7% | $302,800 | 22.0% | 51.63% |
| 22 | Chesterton, IN | 14,045 | 11.5% | $238,700 | 25.0% | 36.35% |
| 23 | Scottsburg, IN | 7,203 | 19.0% | $99,900 | 22.0% | 26.74% |
| 24 | Frankfort, IN | 16,134 | 14.2% | $95,100 | 25.0% | 30.61% |
| 25 | North Vernon, IN | 6,836 | 17.4% | $91,100 | 30.0% | 32.64% |
| 26 | Rushville, IN | 6,289 | 12.5% | $96,100 | 37.0% | 26.75% |
| 27 | Elwood, IN | 8,295 | 17.0% | $70,900 | 32.0% | 27.29% |
| 28 | Schererville, IN | 29,381 | 6.3% | $242,200 | 19.0% | 28.79% |
| 29 | Connersville, IN | 13,556 | 22.3% | $77,800 | 28.0% | 26.89% |
| 30 | Michigan City, IN | 31,965 | 21.2% | $100,300 | 19.0% | 26.8% |
| 31 | Anderson, IN | 54,459 | 22.1% | $84,600 | 25.0% | 25.68% |
| 32 | St. John, IN | 19,805 | 2.4% | $303,100 | 26.0% | 40.22% |
| 33 | Marion, IN | 27,757 | 28.5% | $70,100 | 19.0% | 27.3% |
| 34 | Charlestown, IN | 7,859 | 14.1% | $142,900 | 14.0% | 33.99% |
| 35 | Peru, IN | 11,123 | 22.9% | $66,600 | 30.0% | 29.61% |
| 36 | Beech Grove, IN | 15,202 | 11.8% | $117,100 | 28.0% | 28.02% |
| 37 | Avon, IN | 20,848 | 5.3% | $239,500 | 28.0% | 41.0% |
| 38 | Lawrence, IN | 49,048 | 10.7% | $164,200 | 24.0% | 32.03% |
| 39 | Franklin, IN | 25,112 | 11.7% | $162,000 | 33.0% | 35.47% |
| 40 | Washington, IN | 12,015 | 15.9% | $97,400 | 33.0% | 32.19% |
| 41 | Bargersville, IN | 9,024 | 9.7% | $282,500 | 43.0% | 53.54% |
| 42 | Hartford City, IN | 5,895 | 25.5% | $61,600 | 33.0% | 28.98% |
| 43 | La Porte, IN | 21,993 | 18.0% | $111,100 | 27.0% | 31.27% |
| 44 | Batesville, IN | 7,204 | 15.4% | $185,900 | 26.0% | 38.01% |
| 45 | Hobart, IN | 29,516 | 13.7% | $164,400 | 29.0% | 27.62% |
| 46 | Highland, IN | 23,695 | 8.6% | $175,500 | 25.0% | 29.12% |
| 47 | Salem, IN | 6,276 | 23.0% | $107,100 | 23.0% | 29.34% |
| 48 | Dyer, IN | 16,422 | 5.6% | $235,700 | 20.0% | 29.94% |
| 49 | New Haven, IN | 15,922 | 7.9% | $119,300 | 34.0% | 30.88% |
| 50 | Huntingburg, IN | 6,534 | 17.7% | $101,900 | 22.0% | 29.93% |
| 51 | Garrett, IN | 6,592 | 12.2% | $112,300 | 38.0% | 32.99% |
| 52 | Crown Point, IN | 33,518 | 5.8% | $222,700 | 30.0% | 34.67% |
| 53 | Linton, IN | 5,155 | 15.8% | $73,000 | 39.0% | 25.03% |
| 54 | Richmond, IN | 35,854 | 22.7% | $86,600 | 22.0% | 29.58% |
| 55 | Fort Wayne, IN | 262,676 | 15.5% | $130,700 | 24.0% | 30.58% |
| 56 | Rochester, IN | 6,248 | 13.7% | $115,900 | 27.0% | 27.2% |
| 57 | South Bend, IN | 102,786 | 20.9% | $95,500 | 18.0% | 29.58% |
| 58 | Noblesville, IN | 68,885 | 5.2% | $244,900 | 30.0% | 42.22% |
| 59 | Portland, IN | 6,334 | 16.8% | $79,800 | 26.0% | 29.31% |
| 60 | New Castle, IN | 17,465 | 19.0% | $80,800 | 32.0% | 28.04% |
| 61 | Jeffersonville, IN | 49,178 | 11.5% | $157,300 | 18.0% | 30.8% |
| 62 | Mishawaka, IN | 50,823 | 17.5% | $111,800 | 20.0% | 24.34% |
| 63 | Shelbyville, IN | 19,710 | 12.9% | $104,100 | 32.0% | 29.67% |
| 64 | Nappanee, IN | 7,132 | 9.6% | $156,300 | 40.0% | 28.2% |
| 65 | Winchester, IN | 5,016 | 16.6% | $79,400 | 34.0% | 29.32% |
| 66 | Terre Haute, IN | 58,450 | 25.9% | $87,500 | 21.0% | 26.29% |
| 67 | New Whiteland, IN | 5,565 | 6.4% | $142,300 | 38.0% | 39.51% |
| 68 | Zionsville, IN | 30,258 | 4.3% | $430,900 | 33.0% | 40.9% |
| 69 | Kokomo, IN | 59,263 | 14.5% | $96,400 | 29.0% | 25.66% |
| 70 | Auburn, IN | 13,281 | 9.7% | $129,500 | 34.0% | 35.13% |
| 71 | Bluffton, IN | 10,548 | 9.9% | $107,100 | 38.0% | 30.59% |
| 72 | Seymour, IN | 21,192 | 19.1% | $119,800 | 25.0% | 36.17% |
| 73 | Porter, IN | 5,175 | 6.0% | $206,000 | 30.0% | 29.39% |
| 74 | Carmel, IN | 98,137 | 3.0% | $372,100 | 26.0% | 36.8% |
| 75 | Clarksville, IN | 22,169 | 13.4% | $135,700 | 15.0% | 24.27% |
| 76 | Crawfordsville, IN | 16,279 | 20.0% | $111,300 | 29.0% | 31.33% |
| 77 | Huntington, IN | 17,018 | 17.0% | $84,100 | 29.0% | 29.79% |
| 78 | Greenwood, IN | 62,914 | 7.6% | $181,700 | 30.0% | 34.65% |
| 79 | Indianapolis, IN | 880,104 | 16.4% | $156,300 | 21.0% | 27.41% |
| 80 | Plainfield, IN | 34,311 | 7.4% | $203,700 | 30.0% | 34.62% |
| 81 | Muncie, IN | 65,571 | 30.4% | $78,100 | 21.0% | 22.57% |
| 82 | Boonville, IN | 6,662 | 13.2% | $112,200 | 33.0% | 34.1% |
| 83 | Goshen, IN | 34,792 | 15.4% | $141,900 | 23.0% | 31.43% |
| 84 | Vincennes, IN | 16,892 | 23.7% | $80,000 | 28.0% | 29.99% |
| 85 | Mccordsville, IN | 8,629 | 3.7% | $255,900 | 40.0% | 37.9% |
| 86 | Mooresville, IN | 9,429 | 10.5% | $152,300 | 34.0% | 27.88% |
| 87 | North Manchester, IN | 5,269 | 11.2% | $116,800 | 28.0% | 28.59% |
| 88 | Tipton, IN | 5,211 | 15.0% | $116,300 | 37.0% | 31.32% |
| 89 | New Albany, IN | 37,350 | 17.4% | $139,500 | 19.0% | 27.09% |
| 90 | Cumberland, IN | 5,860 | 4.1% | $168,000 | 32.0% | 33.38% |
| 91 | Tell City, IN | 7,482 | 15.6% | $103,800 | 24.0% | 22.88% |
| 92 | Wabash, IN | 10,420 | 14.8% | $89,700 | 31.0% | 28.26% |
| 93 | Munster, IN | 23,717 | 6.1% | $242,500 | 23.0% | 26.17% |
| 94 | Greenfield, IN | 23,024 | 6.5% | $157,300 | 35.0% | 30.23% |
| 95 | Westfield, IN | 45,695 | 4.6% | $305,700 | 28.0% | 41.92% |
| 96 | Hunte, IN | 8,965 | 1.7% | $193,400 | 39.0% | 52.31% |
| 97 | Decatur, IN | 9,630 | 15.8% | $101,100 | 26.0% | 26.25% |
| 98 | Angola, IN | 8,916 | 18.3% | $148,800 | 21.0% | 29.55% |
| 99 | Lebanon, IN | 17,196 | 10.1% | $145,100 | 30.0% | 32.13% |
| 100 | Whitestown, IN | 9,529 | 3.6% | $261,900 | 34.0% | 49.98% |

I think your full of crap!!!! Union City maybe small town and not a lot of jobs but the residents love this town. If you never lived there you have no clue!! I’m sure you never lived in any off the towns you listed. Small towns have pride and they love the community of a small town.
Wow, the Sarge is all jacked up. I live in one of the “top” 3 and have spent enough time in most of the others to know this list to be fairly accurate. Look, as a commuter life sucks for an extra 10hours a week. This is a purely stats based article, don’t get so worked up.
Gotta say, this is pretty crappy “science”. You chose to look at happiness based on unemployment and college graduate status in an area of the country that relies heavily on manufacturing (especially of luxury goods like RVs) with a dataset that comes right after the hardest part of the recession. Elkhart, Indiana had the highest unemployment rate in the country during the recession. Sure, that made people sad, but with your pictures you make these towns look desolate. Have you ever been to Elkhart or Goshen or Nappanee or Brookville or Greencastle? These are great little towns with lots of character. And seriously?… West Lafayette is home to Purdue.
Do you stupid idiots in North Carolina have a clue as to the true location of the image shown in #6 of the first slideshow? Get an education before you go posting garbage about places you know NOTHING about.
How did Bloomington escape your list with percentages of 23 and 31 percent? Don’t blame it on IU either.
At lease you was right about Gary being number 1
So whete does our little towns like crothersville indiana or deputy indiana fit in
A different evaluation named North Vernon as one of the first two Stellar cities in Indiana, an honor where many communities applied, but only two were selected. How can two evaluations be so far apart – unless the systems are flawed. Also, if you want a level playing field, put up a picture of our downtown, rather than one house in town. We have the largest collection of Mesker storefronts in Indiana. I just came from a community production at our restored Park Theatre Civic Center. The criteria for determining this ranking is very flawed – starting with the assumption that married people are happier than single people. Whoever designed the research methodology would get a failing grade in any research class.
Are married people really happier?
I live in north Vernon and it’s a nice place to live. The house you shown is an older couple whom can’t afford to have their home upkeep. So please take pictures across the street and the surrounding neighborhood! We have good schools good neighborhoods as well as rough neighborhoods like other cities. Check into the surrounding cities, like Austin, Scottsburg, then rate North Vernon!
Did you interview or survey the residents of these communities to ask if their views and experiences were remotely supportive of your conclusions? Sounds more like an evaluation of how close a community is to the nearest SMSA.
The comment was made about science and data being used. Was the research model one that would be recognized as valid for a middle school science fair? Seriously, I live in North Vernon and am familiar with the house pictured. It is a real house, but looks nothing like the house next to it, or across the street.Go to Google Earth, get on North Vernon, go to Jennings Street and you will find it. Then look at others on the same street. Look across the street (Jennings). Then go to the next street over and look at the houses on South State. The pictures are factual and neutral and each person can draw their own conclusions via the broader data. Selective data can prove anything. As for me…I’m happy in North Vernon…Tom Taylor
I’d drive to Dunkirk, Indiana just to ride that double-decker bus!
I’ve been there, and I missed the bus!! I kinda think the writer (s) did too!
North Vernon is a laughingstock like a lot of the towns in Southern Indiana. It’s no different than trash pits like Scottsburg, Austin, Salem, Paoli, Bedford (better known as Methford) and a whole lot of other smaller towns. Not to mention all of the boring dumpy towns around it. The only two that halfway decent cities close to it are Seymour and Columbus. It’s too far to Indianapolis to do a daily commute unless you want to drive an hour and a half. The town cops are crooks and so are most of the politicians.
They average IQ of the town hovers about 85 which is borderline mentally retarded and there are plenty of drug pushers, druggies, meth labs, heroin users and other dopers. I’ve spent plenty of time in North Vernon over the years either passing through to Cincinnati area or heading to my uncles past Greensburg. You’re better off passing it by and not wasting much time here. The job market is revolving around uneducated morons that barely graduated high school much less have the equivalent of a sixth grade education. It’s only saving grace is that its relatively close to Columbus…20 miles so people can get jobs that is the ones that can actually pass a drug test which is getting to be few and far between. The same problem that its close to Seymour but the druggies still can’t get jobs there in the myriad of factories and businesses in that mid sized city as well. Both of those cities have plenty of factories and other types of businesses. Something that doesn’t happen in North Vernon unless you want to work in a couple of the crappy factories with no future or work as a box flipper at Lowes