Do you live in one of the most miserable places in New Hampshire?
Only a third of New Hampshirites say they are truly happy. That’s too bad, considering that folks in New Hampshire don’t really have it too bad in the grand scheme of things.
But, we were curious – which New Hampshire cities might be the most miserable? We’re about to find out, using Saturday Night Science and data.
After analyzing the 26 largest cities, we sadly present the most miserable cities in the Granite State.
Table Of Contents: Top Ten | Methodology | Summary | Table
The 10 Most Miserable Places In New Hampshire
Read on below to see how we crunched the numbers and how your town ranked. If you have a smile on your face, you probably don’t live in one of these cities.
Oh, and by the way, Lebanon is the happiest place in New Hampshire.
For more New Hampshire reading, check out:
The 10 Most Miserable Places In New Hampshire For 2023
/10
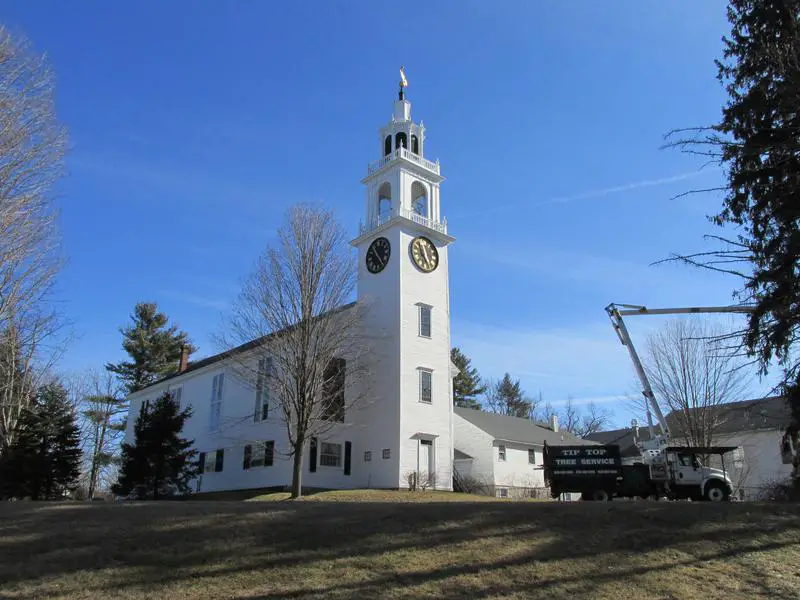
Population: 23,571
Poverty Level: 8.3%
Median Home Price $272,200
Married Households 5.0%
Households With Kids 33.01%
More on Derry: Data | Crime | Cost Of Living
/10
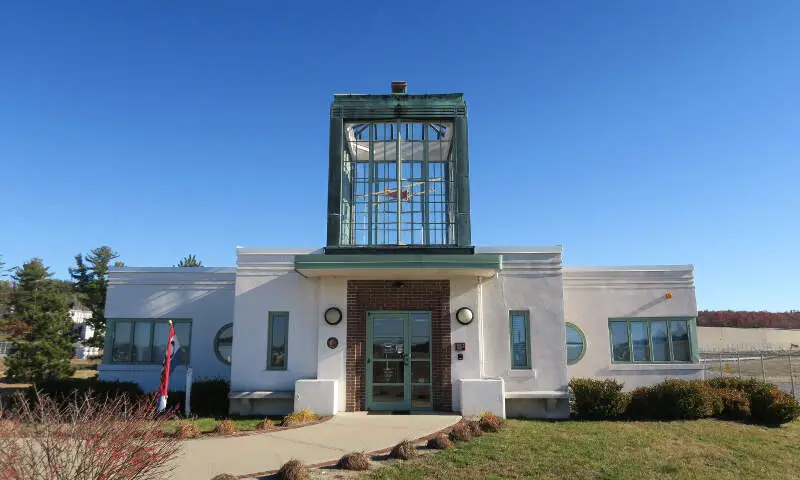
Population: 11,955
Poverty Level: 3.4%
Median Home Price $349,100
Married Households 8.0%
Households With Kids 31.26%
More on Londonderry: Data | Crime | Cost Of Living
/10
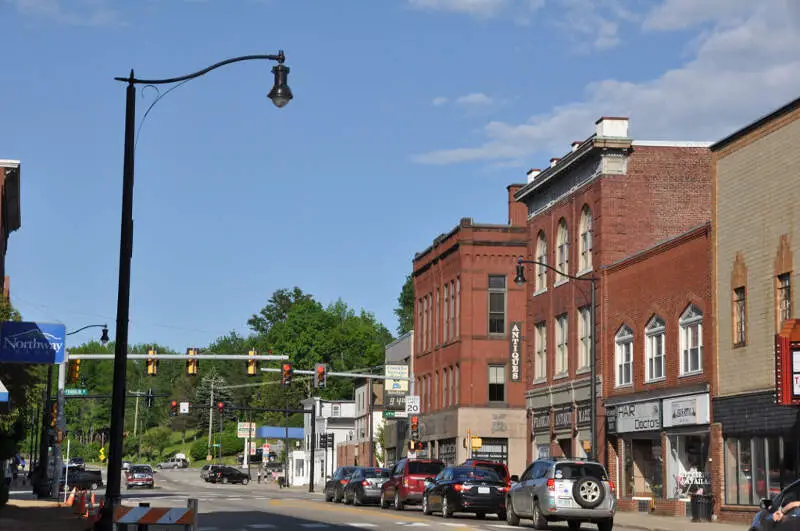
Population: 8,766
Poverty Level: 4.8%
Median Home Price $205,300
Married Households 23.0%
Households With Kids 24.29%
More on Franklin: Data | Crime | Cost Of Living
/10
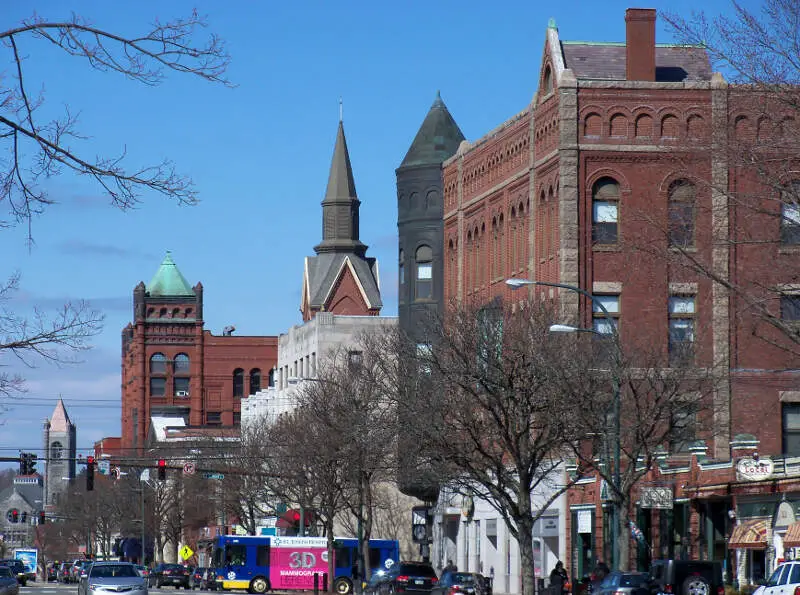
Population: 90,659
Poverty Level: 8.0%
Median Home Price $298,100
Married Households 8.0%
Households With Kids 26.41%
More on Nashua: Data | Crime | Cost Of Living
/10
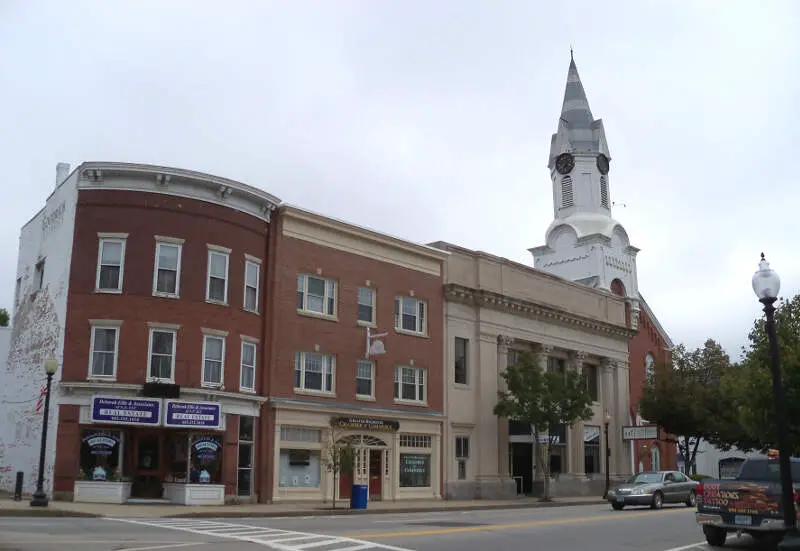
Population: 32,317
Poverty Level: 9.3%
Median Home Price $208,500
Married Households 20.0%
Households With Kids 26.64%
More on Rochester: Data | Crime | Cost Of Living
/10
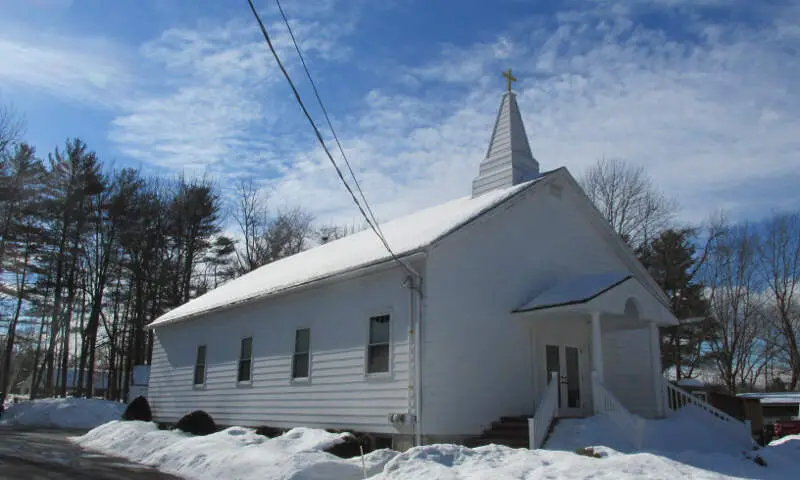
Population: 5,906
Poverty Level: 2.9%
Median Home Price $289,500
Married Households 25.0%
Households With Kids 33.0%
More on South Hooksett: Data | Cost Of Living
/10
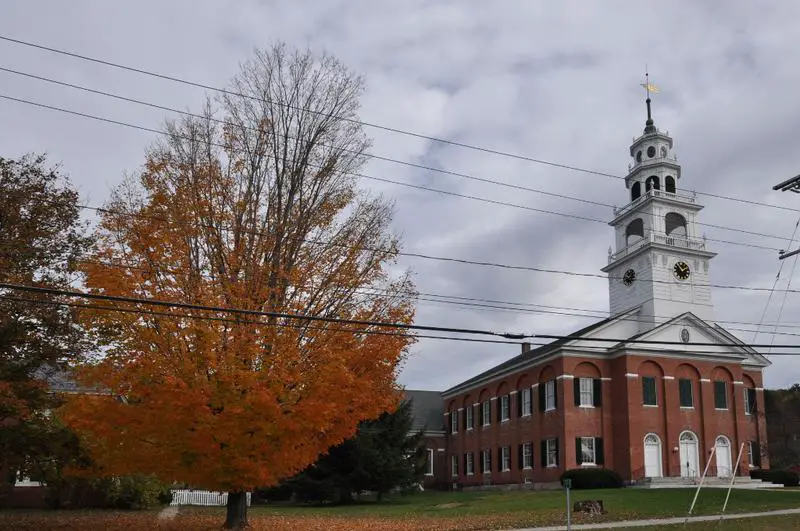
Population: 5,333
Poverty Level: 21.1%
Median Home Price $146,800
Married Households 25.0%
Households With Kids 27.8%
More on Newport: Data | Crime | Cost Of Living
/10
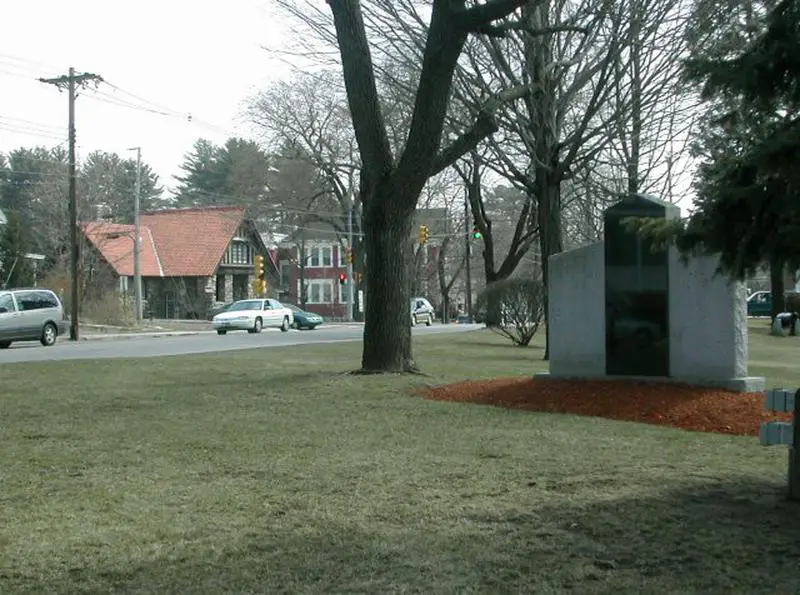
Population: 6,756
Poverty Level: 3.4%
Median Home Price $266,400
Married Households 12.0%
Households With Kids 15.72%
More on Hudson: Data | Crime | Cost Of Living

/10
Population: 9,710
Poverty Level: 13.9%
Median Home Price $79,100
Married Households 25.0%
Households With Kids 27.24%
More on Berlin: Data | Crime | Cost Of Living
/10
Population: 5,669
Poverty Level: 6.3%
Median Home Price $227,200
Married Households 22.0%
Households With Kids 25.35%
More on Hooksett: Data | Crime | Cost Of Living
Methodology: How We Measured The Most Miserable Cities In The Granite State
To rank the unhappiest places in New Hampshire, we had to determine what criteria make people happy. It isn’t a stretch to assume that happy people earn great salaries, are relatively stress-free, and have a stable home life.
So we went to the Census’s American Community Survey 2017-2021 report for the happy criteria, flipped the list with Saturday Night Science, and it spit out the answer.
Like magic.
Here are the criteria we used to measure misery:
- Percentage of residents with a college degree
- Average commute times
- Unemployment rates
- Cost of living
- % of married couples
- % of families with kids
- Poverty rate
After we decided on the criteria, we gathered the data for the 26 places in New Hampshire with over 5,000 people.
We then ranked each place from one to 26 for each of the seven criteria, with a score of one being the most miserable (Any ties were given to the larger place).
Next, we averaged the seven rankings into a Miserable Index for each place with the lowest overall Miserable Index “earning” the title “Most Miserable City In New Hampshire.”
If you’d like to see the complete list of states, most miserable to happiest, scroll to the bottom of this post to see the unabridged chart.
We updated this article for 2023, and it’s our tenth time ranking the most miserable cities in New Hampshire.
There You Have It – The Least Happy Cities In New Hampshire
As we said earlier, trying to determine the most miserable cities in New Hampshire is usually a subjective matter.
But if you’re analyzing cities where people are not stable, where you’re stuck in traffic, and no one spent the time to go to college, then this is an accurate list.
If you’re curious enough, here are the happiest cities in New Hampshire, according to science:
- Lebanon
- Portsmouth
- Hanover
For more New Hampshire reading, check out:
- Best Places To Live In New Hampshire
- Cheapest Places To Live In New Hampshire
- Most Dangerous Cities In New Hampshire
- Richest Cities In New Hampshire
- Safest Places In New Hampshire
- Worst Places To Live In New Hampshire
- Most Expensive Places To Live In New Hampshire
Miserable Cities In New Hampshire For 2023
| Rank | City | Population | Poverty Level | Median Home Value | % Married | % Kids |
|---|---|---|---|---|---|---|
| 1 | Derry, NH | 23,571 | 8.3% | $272,200 | 5.0% | 33.01% |
| 2 | Londonderry, NH | 11,955 | 3.4% | $349,100 | 8.0% | 31.26% |
| 3 | Franklin, NH | 8,766 | 4.8% | $205,300 | 23.0% | 24.29% |
| 4 | Nashua, NH | 90,659 | 8.0% | $298,100 | 8.0% | 26.41% |
| 5 | Rochester, NH | 32,317 | 9.3% | $208,500 | 20.0% | 26.64% |
| 6 | South Hooksett, NH | 5,906 | 2.9% | $289,500 | 25.0% | 33.0% |
| 7 | Newport, NH | 5,333 | 21.1% | $146,800 | 25.0% | 27.8% |
| 8 | Hudson, NH | 6,756 | 3.4% | $266,400 | 12.0% | 15.72% |
| 9 | Berlin, NH | 9,710 | 13.9% | $79,100 | 25.0% | 27.24% |
| 10 | Hooksett, NH | 5,669 | 6.3% | $227,200 | 22.0% | 25.35% |
| 11 | Somersworth, NH | 11,964 | 10.9% | $226,600 | 20.0% | 31.4% |
| 12 | Milford, NH | 8,437 | 8.1% | $256,000 | 15.0% | 24.24% |
| 13 | Concord, NH | 43,552 | 9.3% | $245,800 | 18.0% | 25.22% |
| 14 | Manchester, NH | 114,730 | 12.5% | $258,100 | 14.0% | 24.83% |
| 15 | Suncook, NH | 5,008 | 9.6% | $219,600 | 24.0% | 25.98% |
| 16 | Exeter, NH | 9,908 | 6.7% | $241,000 | 8.0% | 20.42% |
| 17 | Durham, NH | 11,616 | 24.4% | $396,200 | 3.0% | 28.77% |
| 18 | Claremont, NH | 12,955 | 16.7% | $136,600 | 17.0% | 21.29% |
| 19 | Hampton, NH | 9,900 | 3.2% | $400,200 | 14.0% | 25.67% |
| 20 | Newmarket, NH | 5,621 | 6.6% | $300,900 | 9.0% | 19.2% |
| 21 | Laconia, NH | 16,786 | 10.3% | $214,800 | 18.0% | 24.36% |
| 22 | Keene, NH | 22,969 | 11.6% | $193,400 | 10.0% | 18.92% |
| 23 | Dover, NH | 32,599 | 8.0% | $310,500 | 14.0% | 23.24% |
| 24 | Hanover, NH | 8,813 | 10.3% | $610,900 | 4.0% | 25.96% |
| 25 | Portsmouth, NH | 21,897 | 6.0% | $487,900 | 11.0% | 18.05% |
| 26 | Lebanon, NH | 14,316 | 7.8% | $274,400 | 13.0% | 18.89% |

This list really seems to have been created by someone who has never before been to New Hampshire. Newmarket is a college town, thus it is absurd to conclude it is a “miserable” town based on the fact that it has a low marage rate and a low rate of home ownership. On top of that, it takes a lot of audacity to say that Hampton is the “happiest” place. This whole list is upside down, and nobody from New Hampshire would ever take this seriously. The author needs to go back to the drawing board on this one.
You’ve obviously never even been to New Hampshire. You shouldn’t judge a place based on charts and numbers.
We think the numbers give an insight you miss from living there too long. The numbers never lie, people’s perceptions do.
It’s like the Moneyball of Real Estate if you will.
If you walk on the beach in Hampton, it’s not unlikely you’ll step on a syringe.
That’s why Hampton is not only the happiest, but the third most happy as well.
You can’t judge these town on a limited data set, especially without even visiting them. Newmarket is a college town so it’s very transient in it’s population. Not a lot students are married and quite a few remain here after college or come back here to live and start a family. When I put a link to this on my facebook page, everyone defended Newmarket, no matter where they live now, they all have very fond memories of this town.
You need to check out Berlin, NH. That poor town lost it’s paper mill and has been struggling for a long time.
Newmarket is awesome you have no clue wtf you are talking about
This is the dumbest piece of clickbait I’ve ever wasted my time on. I’m not even from New Hampshire, but I have spent a lot of time there. If these are the most miserable places, New Hampshire must not be a very miserable place.
I wonder where the data came for Hillsboro. The population data is way off, it hasn’t been 2000 people in my lifetime, and I’m getting old.
I wonder if this is just some sort of spam site? The picture doesn’t look right either, so I wonder if they are using data from a different Hillsboro, maybe in a different state?
I’d be interested in the formula that was used and the raw data.
Gilford isnt even on list. Almost every college town is. Junk
That is not even a picture of Durham lol this article is terrible and Hampton is disgusting
Another load of garbage written by people who think they a wicked smaht!
The whole Upper Valley stinks unless you’re rich or have a decent job.