
Detroit’s neighborhoods conjure up too many stereotypes to count. You’ve got hipster areas, preppy places, neighborhoods where college kids thrive, and of course, ghettos.
It seems as if there’s a neighborhood for everyone in Detroit.
And while the city consistently ranks as one of the best places to live in Michigan thanks in part to tons of entertainment and jobs, it’s not all rainbows and sunshine in Detroit. Some neighborhoods aren’t as safe as others.
So the question arises, which Detroit neighborhoods are the most dangerous and which are the safest?
Today, we’ll use Saturday Night Science to determine which Detroit hoods need a little tender loving care – the sore thumbs of the Detroit area if you will. Realistically, you can’t expect all the neighborhoods to be amazing, although Downtown ranks way above the rest.
We examined 82 of Detroit’s neighborhoods to find out the most dangerous places to live. These places don’t quite measure up to Detroit’s reputation.
Table Of Contents: Top 10 | Methodology | Summary | Table
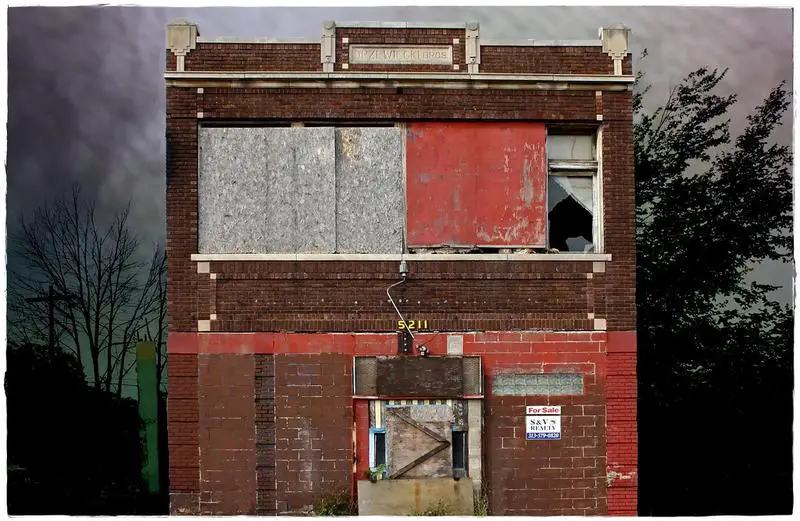
So what’s the worst neighborhood to live in Detroit for 2025? According to the most recent census data, Lasalle College Park looks to be the worst neighborhood in Detroit.
Read on to see how we determined the places around Detroit that need a pick-me-up. And remember, don’t blame the messenger.
For more Michigan reading, check out:
The 10 Most Dangerous Neighborhoods In Detroit For 2025
/10
Population: 2,986
Violent Crimes Per 100k: 4,463
Property Crime Per 100k: 7,792
Median Home Value: $29,850 (2nd worst)
Median Income: $30,170 (22nd worst)
More on Lasalle College Park: Data
/10
Population: 9,938
Violent Crimes Per 100k: 4,009
Property Crime Per 100k: 7,394
Median Home Value: $36,667 (10th worst)
Median Income: $29,596 (20th worst)
More on Brightmoor: Data
Located in the northwest part of the city, Brightmoor came into existence in the 1920s as a planned community. Fast forward to the early 21st century and the plan has gone awry. The neighborhood now stands as one of the worst places to live in all of Detroit.
A weak job market complicates life for Brightmoor’s 9,938 residents. They have to deal with an unemployment rate of 11.7%, along with a median income of $29,596. The median home value comes in at $36,667.
There are bright spots to life in Brightmoor. For instance, residents can check out Eliza Howell Park.
/10
Population: 5,819
Violent Crimes Per 100k: 5,677
Property Crime Per 100k: 9,026
Median Home Value: $41,671 (17th worst)
Median Income: $29,368 (19th worst)
More on Grandale: Data
/10
Population: 2,605
Violent Crimes Per 100k: 2,775
Property Crime Per 100k: 6,400
Median Home Value: $30,800 (3rd worst)
Median Income: $22,070 (8th worst)
More on Fishkorn: Data
/10
Population: 761
Violent Crimes Per 100k: 4,285
Property Crime Per 100k: 3,935
Median Home Value: $56,900 (34th worst)
Median Income: $16,558 (3rd worst)
More on Carbon Works: Data
As you might guess from its name, Carbon Works has an industrial character. Unfortunately for this working-class neighborhood built along the Rouge River in southwest Detroit, residents can’t count on those industrial jobs anymore. The result: Carbon Works has become one of the least inviting neighborhoods in the city.
The unemployment rate says it all: 9.6% of the area’s 761 residents can’t find a job. Meanwhile, the median income comes in at just $16,558. The area also suffers from weak schools and worries about crime.
Still, there are attractions in the area. A strong nightlife and excellent diversity contribute to the local culture. Meanwhile, Forman Park provides a nice outdoor patch by the river.
/10
Population: 1,945
Violent Crimes Per 100k: 2,262
Property Crime Per 100k: 5,218
Median Home Value: $47,550 (25th worst)
Median Income: $9,945 (worst)
More on Nw Goldberg: Data
/10
Population: 6,355
Violent Crimes Per 100k: 2,500
Property Crime Per 100k: 5,767
Median Home Value: $37,922 (12th worst)
Median Income: $25,553 (11th worst)
More on Petosky-Otsego: Data
Petosky-Otsego is a smaller neighborhood in central Detroit, with a population of 6,355. It also ranks as the number 7 least appealing place to live in the city.
The economy makes Petosky-Otsego a difficult place to put down roots. Residents suffer with a 9.8% unemployment rate and a $25,553 median income. At the same time, crime and education are also problems.
Petosky-Otsego has its upsides, though. The area is affordable, with median home values of $37,922. It also has its share parks.
/10
Population: 360
Violent Crimes Per 100k: 2,415
Property Crime Per 100k: 5,570
Median Home Value: $38,950 (14th worst)
Median Income: $24,625 (10th worst)
More on Poletown East: Data
Poletown East gets its name from the Polish immigrants who moved to the area, starting in the late 19th century. This east-side neighborhood is bounded to the north by I-94, within sight of a General Motors assembly plant. This doesn’t do much to provide jobs to the area – the local economy is so bad it dooms the neighborhood as the number 8 least attractive place to put down roots in Detroit.
Just look at the stats: a 6.8% unemployment rate and a $24,625 median income. Home prices are at least affordable, though that comes with a run-down housing stock. The median home value sits at $38,950.
/10
Population: 3,500
Violent Crimes Per 100k: 2,434
Property Crime Per 100k: 5,614
Median Home Value: $35,538 (9th worst)
Median Income: $32,183 (32nd worst)
More on Riverdale: Data
A rough economic climate presents the main obstacle for people in Riverdale, a neighborhood in the northwest section of the city. The area also suffers from substandard schools and a high crime rate. Taken together, these forces make the area one of the least attractive spots in Detroit.
Just look at the numbers: Riverdale sports an unemployment rate of 9.1% and a median income of $32,183. These financial figures make it difficult for locals to fund schools and other services.
That said, Riverdale has its share of bright spots as well. The nightlife is engaging and the cost of living is affordable. The neighborhood houses its share of green spaces as well, including the Rouge Valley Parkway.
/10
Population: 3,088
Violent Crimes Per 100k: 3,260
Property Crime Per 100k: 7,385
Median Home Value: $91,300 (50th worst)
Median Income: $21,670 (6th worst)
More on Core City: Data
Methodology: How we determined the most dangerous Detroit neighborhoods in 2025
To figure out how bad a place is to live in, we only needed to know what kinds of things people like and then decide what places have the least amount of those things. We plugged the following criteria into Saturday Night Science to get the worst neighborhoods in Detroit:
- High crime (Estimated)
- High unemployment (Less jobs)
- Low median income (Less pay)
- Low population density (No things to do)
- Low home values (No one’s willing to pay to live here)
Then, we ranked each neighborhood in Detroit, Michigan for each of these criteria from worst to best.
Next, we averaged the individual rankings for each criterion into a “Worst Score.”
The neighborhood with the lowest “Worst Score” ranks as the most dangerous neighborhood of Detroit.
The article is an opinion based on facts and is meant as infotainment. We updated this article for 2025. This report is our time ranking the worst neighborhoods to live in Detroit.
Skip to the end to see the list of all 82 neighborhoods ranked from worst to best.
Summary: The Worst Neighborhoods Around Detroit
Well, there you have it — the worst of the neighborhoods in Detroit with Lasalle College Park landing at the bottom of the pack.
The worst neighborhoods in Detroit are Lasalle College Park, Brightmoor, Grandale, Fishkorn, Carbon Works, Nw Goldberg, Petosky-Otsego, Poletown East, Riverdale, and Core City.
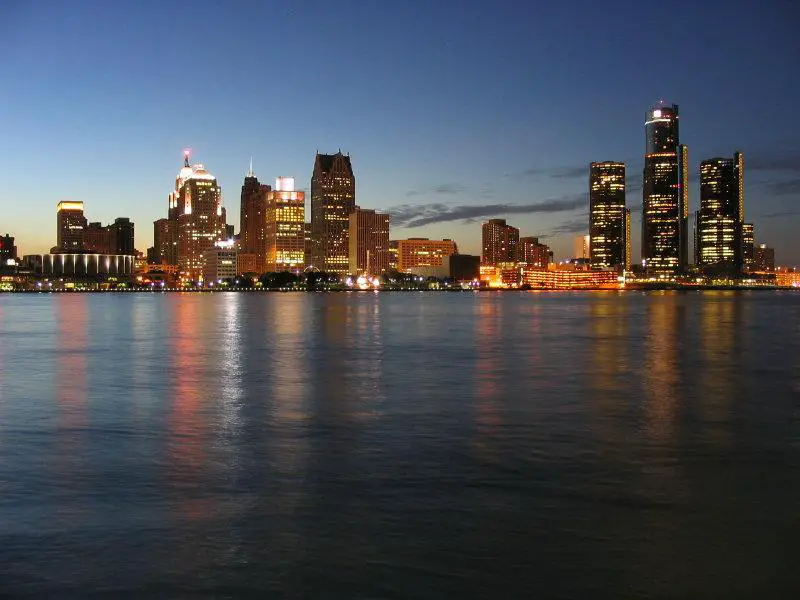
As mentioned earlier, the neighborhoods in Detroit aren’t all bad. Downtown takes the cake as the best place to live in Detroit.
The best neighborhoods in Detroit are Downtown, Indian Village, Green Acres, West Side Industrial, and Brush Park.
We ranked the neighborhoods from worst to best in the chart below.
For more Michigan reading, check out:
Most Dangerous Neighborhoods To Live In Detroit For 2025?
| Rank | Neighborhood | Population | Home Value | Median Income |
|---|---|---|---|---|
| 1 | Lasalle College Park | 2,986 | $29,850 | $30,170 |
| 2 | Brightmoor | 9,938 | $36,667 | $29,596 |
| 3 | Grandale | 5,819 | $41,671 | $29,368 |
| 4 | Fishkorn | 2,605 | $30,800 | $22,070 |
| 5 | Carbon Works | 761 | $56,900 | $16,558 |
| 6 | Nw Goldberg | 1,945 | $47,550 | $9,945 |
| 7 | Petosky-Otsego | 6,355 | $37,922 | $25,553 |
| 8 | Poletown East | 360 | $38,950 | $24,625 |
| 9 | Riverdale | 3,500 | $35,538 | $32,183 |
| 10 | Core City | 3,088 | $91,300 | $21,670 |
| 11 | Barton-Mcfarland | 9,437 | $39,000 | $30,206 |
| 12 | Kranz Woods | 4,438 | $31,967 | $36,712 |
| 13 | Pulaski | 4,391 | $32,150 | $32,964 |
| 14 | Belmont | 2,541 | $59,800 | $28,228 |
| 15 | Franklin Park | 10,830 | $42,500 | $33,092 |
| 16 | Mcdougall-Hunt | 993 | $65,000 | $27,344 |
| 17 | Warrendale | 20,647 | $32,118 | $26,435 |
| 18 | Van Steuban | 4,655 | $43,240 | $32,665 |
| 19 | Chaldean Town | 1,183 | $50,950 | $27,653 |
| 20 | Chandler Park | 1,496 | $53,100 | $31,282 |
| 21 | Ravendale | 2,304 | $32,950 | $32,595 |
| 22 | Fitzgerald | 6,434 | $42,025 | $33,257 |
| 23 | Greensbriar | 2,563 | $32,500 | $38,794 |
| 24 | Eight Mile Wyoming | 1,495 | $42,000 | $30,830 |
| 25 | Mohican Regent | 2,817 | $37,350 | $38,410 |
| 26 | English Village | 478 | $38,000 | $31,734 |
| 27 | Grandmont-Rosedale | 10,600 | $77,511 | $37,632 |
| 28 | Eliza Howell | 839 | $17,300 | $45,321 |
| 29 | Alden Park | 202 | $123,400 | $18,516 |
| 30 | Herman Gardens | 847 | $82,200 | $21,835 |
| 31 | Boynton | 3,422 | $47,600 | $32,478 |
| 32 | The Eye | 3,637 | $43,900 | $33,835 |
| 33 | Castle Rouge | 2,314 | $56,400 | $35,214 |
| 34 | Five Points | 2,721 | $41,667 | $36,870 |
| 35 | Berg-Lasher | 4,736 | $59,025 | $30,388 |
| 36 | Elmwood Park | 6,545 | $87,550 | $24,482 |
| 37 | Forest Park | 956 | $114,700 | $20,271 |
| 38 | Grandmont | 2,332 | $53,600 | $55,696 |
| 39 | Briggs | 1,482 | $100,050 | $30,023 |
| 40 | Weatherby | 1,414 | $50,750 | $31,667 |
| 41 | West Village | 1,035 | $191,800 | $27,486 |
| 42 | Millenium Village | 932 | $99,200 | $43,615 |
| 43 | Aviation | 3,888 | $44,625 | $37,824 |
| 44 | Islandview | 5,435 | $77,000 | $29,100 |
| 45 | Morningside | 11,077 | $56,950 | $40,168 |
| 46 | Michigan-Martin | 732 | $47,600 | $43,083 |
| 47 | Martin Park | 3,917 | $72,700 | $42,054 |
| 48 | Conner Creek Ind | 1,529 | $134,800 | $92,700 |
| 49 | Russell Woods | 2,106 | $66,300 | $29,366 |
| 50 | Regent Park | 2,504 | $50,150 | $61,724 |
| 51 | Springwells | 13,921 | $46,427 | $34,402 |
| 52 | Park | 4,761 | $58,900 | $57,177 |
| 53 | Southwest Detroit | 13,628 | $72,842 | $39,042 |
| 54 | Jefferson Chalmers | 5,450 | $109,860 | $43,693 |
| 55 | Old Redford | 499 | $151,100 | $66,524 |
| 56 | New Center | 1,344 | $224,750 | $34,956 |
| 57 | Rosedale Park | 3,918 | $129,500 | $66,431 |
| 58 | Bagley | 11,872 | $91,311 | $46,365 |
| 59 | East English Village | 3,392 | $70,250 | $59,015 |
| 60 | Hubbard-Richard | 1,880 | $101,867 | $47,120 |
| 61 | North Rosedale Park | 4,488 | $118,700 | $75,824 |
| 62 | Lasalle Gardens | 1,785 | $91,600 | $39,232 |
| 63 | Wayne State | 3,905 | $251,100 | $31,583 |
| 64 | Joseph Barry | 445 | $104,400 | $41,544 |
| 65 | Sherwood Forest | 975 | $297,900 | $113,750 |
| 66 | Woodbridge | 1,992 | $241,850 | $93,380 |
| 67 | Jefferies | 1,771 | $227,100 | $15,671 |
| 68 | Gold Coast | 1,376 | $57,000 | $48,433 |
| 69 | Detroit Golf | 1,976 | $300,550 | $71,984 |
| 70 | University District | 3,083 | $251,600 | $83,828 |
| 71 | Minock Park | 2,285 | $78,050 | $45,276 |
| 72 | Lafayette Park | 5,628 | $163,200 | $37,930 |
| 73 | Art Center | 2,225 | $256,100 | $31,264 |
| 74 | Corktown | 694 | $301,800 | $50,284 |
| 75 | Marina District | 416 | $238,100 | $92,700 |
| 76 | Rivertown | 1,308 | $238,150 | $56,804 |
| 77 | Midtown | 9,997 | $359,583 | $30,191 |
| 78 | Brush Park | 1,873 | $397,900 | $43,444 |
| 79 | West Side Industrial | 565 | $250,800 | $76,604 |
| 80 | Green Acres | 1,217 | $170,800 | $61,019 |
| 81 | Indian Village | 1,756 | $389,300 | $103,506 |
| 82 | Downtown | 5,889 | $371,700 | $65,153 |
Will you continue to update theses results as they change annually? I love this post! A lot of research and data went into this one. Thanks a lot!
Where’s boston edison and north end?
Chaldean Town is no 1 Poletown East is no 2 Petoskey otsingo is no 3 Carbon Works is no 4 NW Goldberg is no 5 Briggs is no6 Brightmoor is no 7 Oakwood Hts is no 8 State Fair Grounds is no 9 Ravendale is no 10
From the data
1. 7Mile & Gratiot
2.Chaldean Town
3.Petosky Otsigo
4.Poletown East
5.7Mile John R
6.Brightmoor
7.Forest Park
8.Dextar Linwood
9.Riverdale
10.McDougall Hunt
I’ve lived inside Detroit MI for 62 yrs and believe me Chaldean town is very quiet and safe as well as Poletown and please emphasize the first calculation is median income and property value and not crime….I’m in the College Park area and Love it here, The areas around major Colleges/Universities are safer with their own Patrols.
Where are West Outer Drive and Far West? These neighborhoods are west of Rouge Park and have some of the lowest crime in the city. We are consistently excluded with our 48239 zip code.