Denver’s neighborhoods conjure up too many stereotypes to count. You’ve got hipster areas, preppy places, neighborhoods where college kids thrive, and of course, ghettos.
It seems as if there’s a neighborhood for everyone in Denver.
And while the city consistently ranks as one of the best places to live in Colorado thanks in part to tons of entertainment and jobs, it’s not all rainbows and sunshine in Denver. Some neighborhoods aren’t as safe as others.
So the question arises, which Denver neighborhoods are the most dangerous and which are the safest?
Today, we’ll use Saturday Night Science to determine which Denver hoods need a little tender loving care – the sore thumbs of the Denver area if you will. Realistically, you can’t expect all the neighborhoods to be amazing, although Washington Park ranks way above the rest.
We examined 22 of Denver’s neighborhoods to find out the most dangerous places to live. These places don’t quite measure up to Denver’s reputation.
The Most Dangerous Neighborhoods In Denver For 2023
So what’s the worst neighborhood to live in Denver for 2023? According to the most recent census data, Central West Denver looks to be the worst neighborhood in Denver.
Read on to see how we determined the places around Denver that need a pick-me-up. And remember, don’t blame the messenger.
For more Colorado reading, check out:
- Best Places To Live In Colorado
- Cheapest Places To Live In Colorado
- Most Dangerous Cities In Colorado
Table Of Contents: Top 10 | Methodology | Summary | Table
The 10 Most Dangerous Neighborhoods In Denver For 2023
/10
Population: 50,475
Violent Crimes Per 100k: 1,709
Property Crime Per 100k: 6,703
Median Home Value: $245,607 (4th worst)
Median Income: $49,508 (worst)
More on Central West Denver: Data
Most of these “worst” lists get stocked by poverty-stricken neighborhoods. Just a litany of urban blight and economic heartache. You’ll often find double-digit unemployment and median incomes in the sub-$30,000 range.
Not here. The number 1 worst section of Denver for 2023 actually boasts a relatively healthy economy. Sure, the unemployment rate stands at an elevated 5.1%. But the area supports a robust median income of $49,508.
However, these paychecks have to cover a relatively high cost of living. That represents the neighborhood’s major problem. The median home value hovers at a level of $245,607.
/10
Population: 25,549
Violent Crimes Per 100k: 1,423
Property Crime Per 100k: 5,429
Median Home Value: $226,148 (2nd worst)
Median Income: $53,074 (2nd worst)
More on Northern Denver: Data
It’s hard to get lost going to Northern Denver. Start at downtown and head north. But don’t let the boring name fool you. Northern Denver represents a relatively inviting neighborhood.
The good news starts with the economy. It hums along at a good pace, supporting an unemployment rate of 3.7% and a median income above $50,000. So far, so good.
Now for the bad news. Once again, high prices mar the neighborhood’s reputation. That cost of living makes it difficult for many locals to make ends meet. An elevated median home value plays into this trend, with a figure hovering at $226,148.
/10
Population: 30,609
Violent Crimes Per 100k: 815
Property Crime Per 100k: 5,757
Median Home Value: $293,687 (6th worst)
Median Income: $62,992 (5th worst)
More on Northwestern Denver: Data
If you’re paying attention, you’ll recognize a pattern developing on this list. Nice neighborhoods. Plentiful amenities. Low crime. Strong economies. Yet mentioned here among the least appealing parts of Denver, thanks largely to a high cost of living.
Well, you won’t find an exception here. Northwestern Denver follows the same logical course. Along with access to lots of restaurants, shops, and other amenities, the area features a thriving financial base. The median income sits at $62,992 and the unemployment rate hovers at 3.9%. But, oh, those housing prices. In this case, the median level stands at $293,687.

/10
Population: 28,587
Violent Crimes Per 100k: 767
Property Crime Per 100k: 3,724
Median Home Value: $366,040 (8th worst)
Median Income: $82,311 (10th worst)
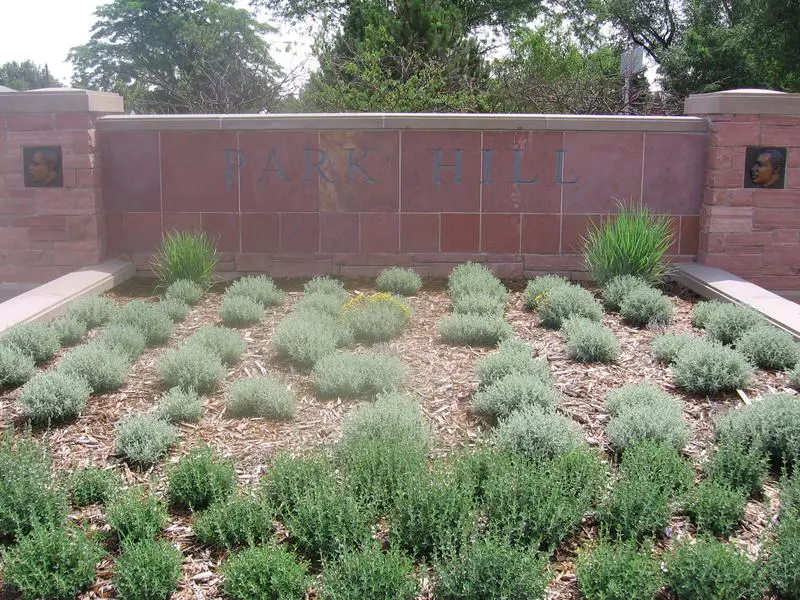
More on Park Hill: Data
/10
Population: 35,927
Violent Crimes Per 100k: 512
Property Crime Per 100k: 1,802
Median Home Value: $222,990 (worst)
Median Income: $68,544 (8th worst)
More on Gateway-Green Valley Ranch: Data
Gateway and Green Valley Ranch are often counted as separate neighborhoods. They sit next to each other near the eastern outskirts of the city. About 20 minutes from downtown, these areas presents a longer commute than many of the other neighborhoods on this list.
That said, there are selling points. To the north, for instance, you’ve got the Rocky Mountain Arsenal National Wildlife Refuge.
Once again, the benefits come with a high price tag. Purchasing most houses in the area will set you back more than $200,000. However, that becomes easier in an area with a median income of nearly $70,000 and an unemployment rate of just 4.1%.

/10
Population: 11,380
Violent Crimes Per 100k: 580
Property Crime Per 100k: 6,203
Median Home Value: $325,227 (7th worst)
Median Income: $54,018 (3rd worst)
More on Alamo Placita: Data
The Texas version of the Alamo was the site of a famous bloody battle, where all the Americans inside were desperately slaughtered. Yes, Alamo Placita ranks as the number 6 worst neighborhood in Denver for 2023. But living here is at least slightly better than surviving a siege.
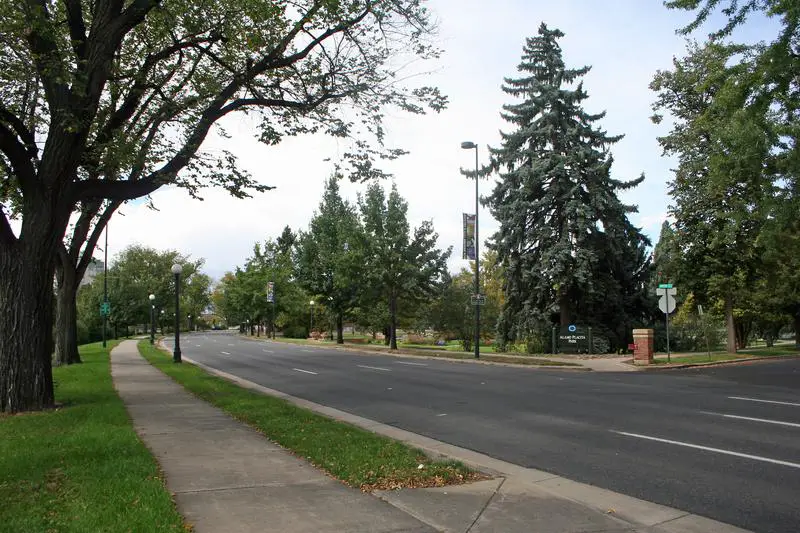
Let’s focus for a second on the “Placita” part of the name. It evokes the word “placid,” a term meaning peaceful or calm. You get some of that here. Alamo Placita Park advertises itself as a picnic area featuring “vibrant flower gardens.”
None of this inviting “placita” comes cheap, however. To buy a house here, the median price tag runs $325,227. That comes in an area where the median income equals $54,018.
/10
Population: 123,093
Violent Crimes Per 100k: 748
Property Crime Per 100k: 3,499
Median Home Value: $227,605 (3rd worst)
Median Income: $54,762 (4th worst)
More on Southwestern Denver: Data
/10
Population: 123,683
Violent Crimes Per 100k: 546
Property Crime Per 100k: 3,160
Median Home Value: $277,859 (5th worst)
Median Income: $64,624 (7th worst)
More on Southeastern Denver: Data
/10
Population: 15,881
Violent Crimes Per 100k: 1,983
Property Crime Per 100k: 10,464
Median Home Value: $384,269 (9th worst)
Median Income: $64,389 (6th worst)
More on Capitol Hill: Data
Did you know that Denver is the capital of Colorado? Well, you do now. And, with that little tidbit of information, you can probably guess how Capitol Hill gets its name.
This a little embarrassing: the home of the state capitol ends up in the number 9 worst spot in Denver. And, no, it’s not because other residents have to deal with all those politicians. The main problem comes from high prices.
Getting a home this close to the halls of power makes the cost of living difficult. The median home value sits at $384,269, compared to a median income of $64,389.
/10
Population: 3,355
Violent Crimes Per 100k: 2,002
Property Crime Per 100k: 10,545
Median Home Value: $575,033 (19th worst)
Median Income: $83,430 (11th worst)
More on City Park: Data
New York City has its Central Park. Denver has its City Park. This area, located west of the Central Business District, contains loads of attractions. Of course, you have the park itself, complete with the Ferril Lake and Duck Lake. On top of this, you’ll find the Denver Zoo and the Denver Museum of Nature & Science.
The residential part of the area extends a couple of blocks south of the park. Unfortunately, the prime location comes at a hefty cost. The median home value stands at $575,033. Not quite what you you’d find for park-adjacent real estate in NYC…but still a difficult mortgage to swing when the local median income equals $83,430.
Methodology: How we determined the most dangerous Denver neighborhoods in 2023
To figure out how bad a place is to live in, we only needed to know what kinds of things people like and then decide what places have the least amount of those things. We plugged the following criteria into Saturday Night Science to get the worst neighborhoods in Denver:
- High crime (Estimated)
- High unemployment (Less jobs)
- Low median income (Less pay)
- Low population density (No things to do)
- Low home values (No one’s willing to pay to live here)
Then, we ranked each neighborhood in Denver, Colorado for each of these criteria from worst to best.
Next, we averaged the individual rankings for each criterion into a “Worst Score.”
The neighborhood with the lowest “Worst Score” ranks as the most dangerous neighborhood of Denver.
The article is an opinion based on facts and is meant as infotainment. We updated this article for 2023. This report is our time ranking the worst neighborhoods to live in Denver.
Skip to the end to see the list of all 22 neighborhoods ranked from worst to best.
Summary: The Worst Neighborhoods Around Denver
Well, there you have it — the worst of the neighborhoods in Denver with Central West Denver landing at the bottom of the pack.
As mentioned earlier, the neighborhoods in Denver aren’t all bad. Washington Park takes the cake as the best place to live in Denver.
We ranked the neighborhoods from worst to best in the chart below.
For more Colorado reading, check out:
Most Dangerous Neighborhoods To Live In Denver For 2023?
| Rank | Neighborhood | Population | Home Value | Median Income |
|---|---|---|---|---|
| 1 | Central West Denver | 50,475 | $245,607 | $49,508 |
| 2 | Northern Denver | 25,549 | $226,148 | $53,074 |
| 3 | Northwestern Denver | 30,609 | $293,687 | $62,992 |
| 4 | Park Hill | 28,587 | $366,040 | $82,311 |
| 5 | Gateway-Green Valley Ranch | 35,927 | $222,990 | $68,544 |
| 6 | Alamo Placita | 11,380 | $325,227 | $54,018 |
| 7 | Southwestern Denver | 123,093 | $227,605 | $54,762 |
| 8 | Southeastern Denver | 123,683 | $277,859 | $64,624 |
| 9 | Capitol Hill | 15,881 | $384,269 | $64,389 |
| 10 | City Park | 3,355 | $575,033 | $83,430 |
| 11 | Stapleton | 25,262 | $538,212 | $126,734 |
| 12 | Central East Denver | 64,393 | $416,967 | $88,432 |
| 13 | Highland | 10,549 | $538,020 | $89,050 |
| 14 | University | 9,938 | $445,780 | $86,261 |
| 15 | Baker | 6,749 | $433,440 | $90,714 |
| 16 | Cherry Creek | 6,954 | $782,740 | $133,998 |
| 17 | Jefferson Park | 3,379 | $539,467 | $88,699 |
| 18 | Golden Triangle | 1,873 | $418,600 | $83,929 |
| 19 | Lodo | 8,519 | $441,900 | $71,476 |
| 20 | Auraria | 858 | $1,002,100 | $94,202 |
| 21 | Five Points | 19,079 | $555,882 | $88,369 |
| 22 | Washington Park | 7,509 | $816,840 | $165,855 |

