Most Americans have never been to small town Kentucky. However, as the Kentuckian who live there know, small town Kentucky is an awesome place to call home.
But is it all roses? Definitely not. Just like any other state, Kentucky has its trouble spots. This article aims to determine, using Saturday Night Science, the absolute worst small towns to live in the Bluegrass State. Don’t freak out, we will use data to show which places have high crime, poverty, and unemployment.
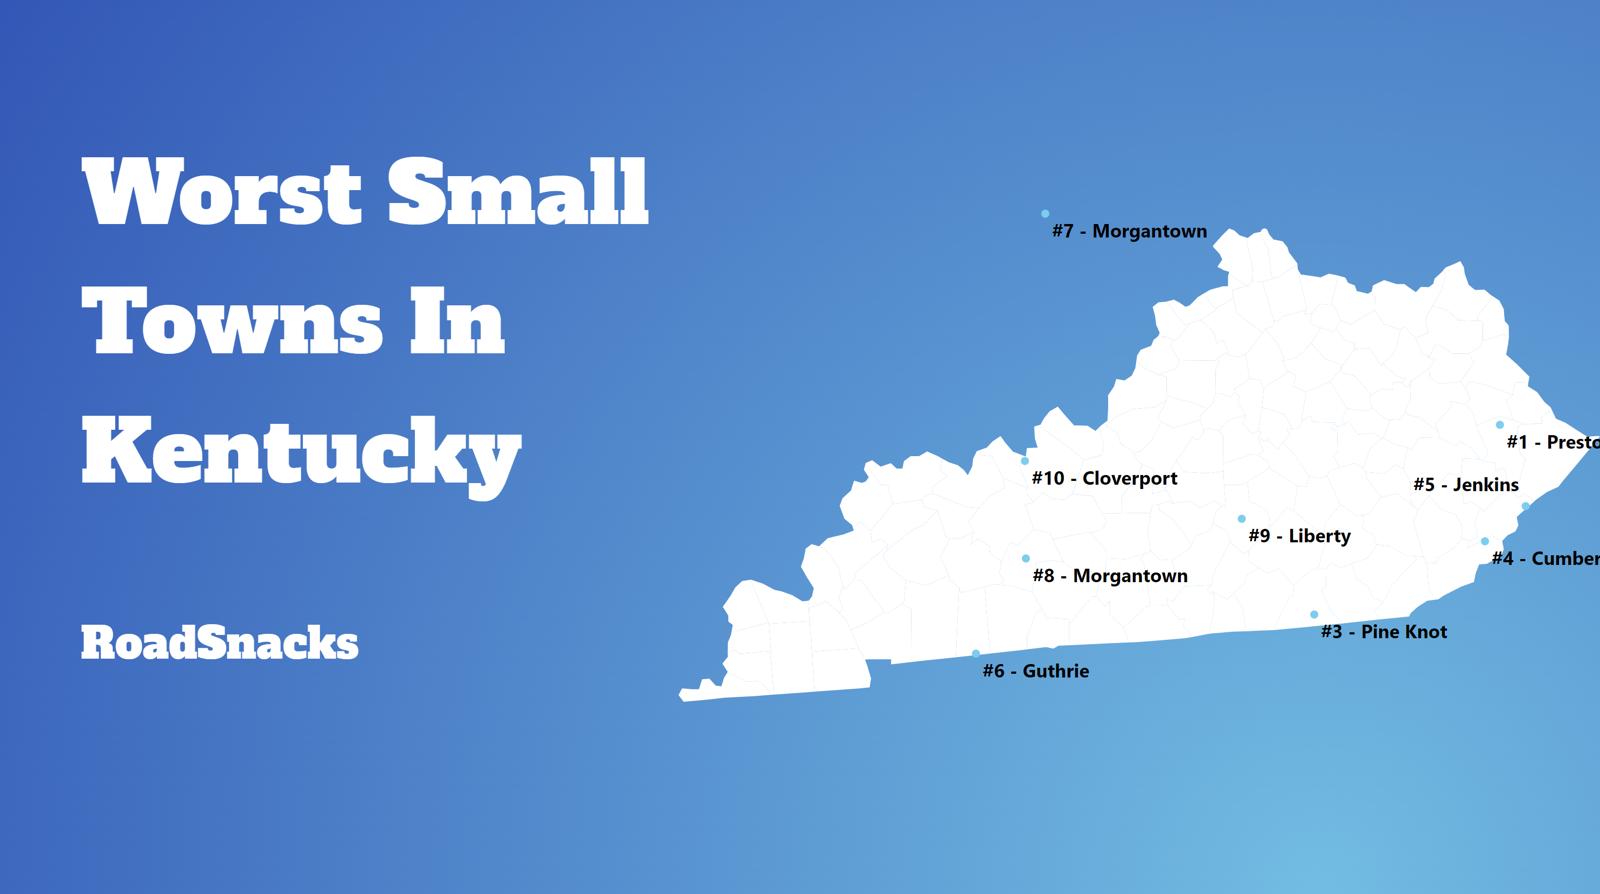
After analyzing more than 159 of Kentucky’s smallest cities, we came up with this list as the 10 worst small towns in Kentucky where you’d never want to live:
Table Of Contents: Top Ten | Methodology | Summary | Table
These are the worst small towns in Kentucky for 2024:
- Prestonsburg
- Clay City
- Pine Knot
- Cumberland
- Jenkins
- Guthrie
- Morgantown
- Liberty
- Cloverport
- Hickman
So what is the worst small town to call home in Kentucky for 2024? According to the most recent census data, Prestonsburg is the worst small town to live in Kentucky.
While many of these small towns have seen better days, they have wonderful communities and people. This report in no way means to knock the folks that call towns like Prestonsburg home. Everyone
Read on below to see how we crunched the numbers, or scroll to the bottom to see how your town ranked.
And if you already know about the small towns, check out the best places to live in Kentucky or the worst places to live in Kentucky.
If you’re looking for something more national, check out the worst cities in America or the worst states in America.
The 10 Worst Small Towns In Kentucky For 2024
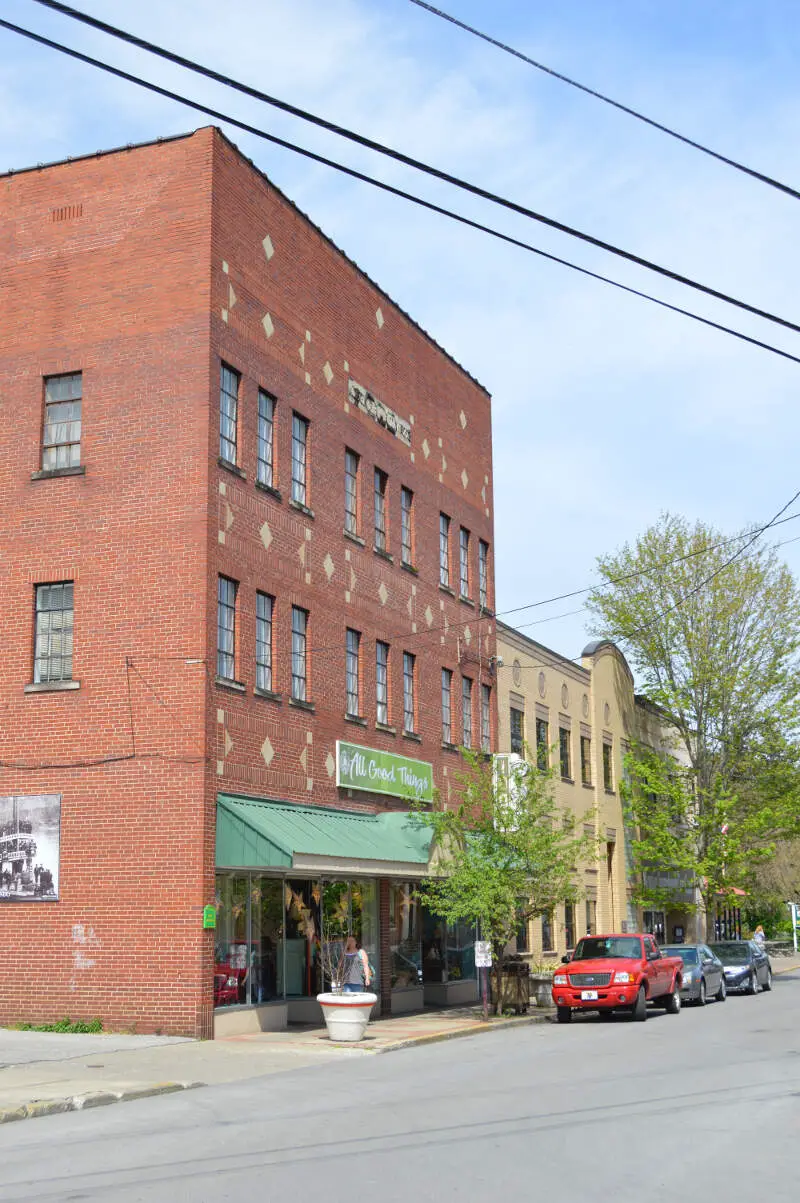
1. Prestonsburg
/10
Population: 3,868
Median Home Value: $111,057
Median Income: $27,099
Unemployment Rate: 14.8%
2. Clay City

Population: 1,567
Median Home Value: $115,738
Median Income: $22,929
Unemployment Rate: 11.9%
3. Pine Knot
/10
Population: 1,483
Median Home Value: $92,563
Median Income: $1,000
Unemployment Rate: 3.9%
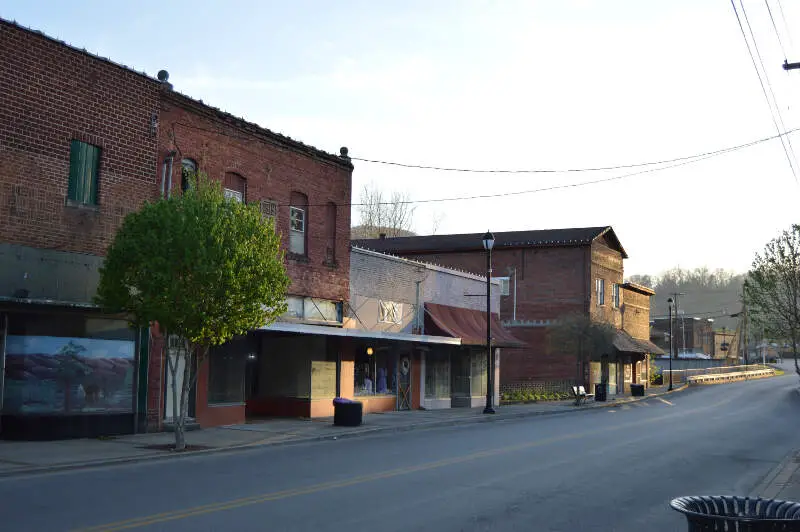
4. Cumberland
/10
Population: 2,390
Median Home Value: $48,817
Median Income: $32,716
Unemployment Rate: 42.5%
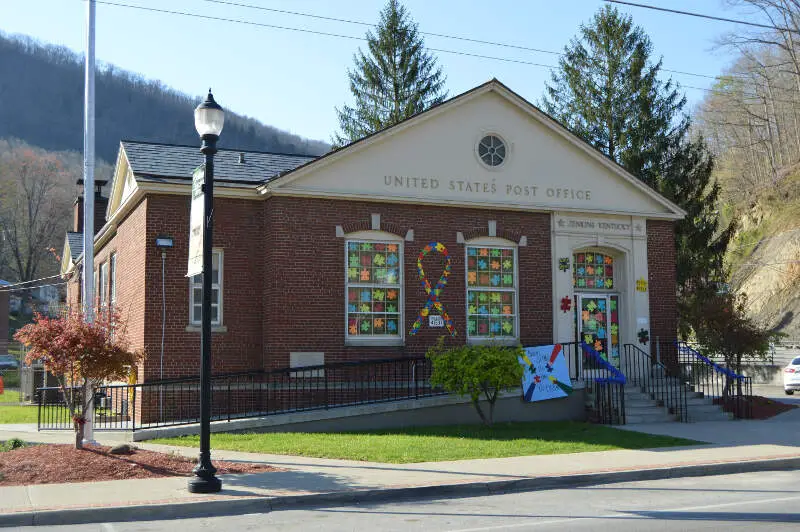
5. Jenkins
/10
Population: 1,862
Median Home Value: $61,845
Median Income: $26,500
Unemployment Rate: 17.0%
6. Guthrie
/10
Population: 1,414
Median Home Value: $159,376
Median Income: $34,118
Unemployment Rate: 15.9%
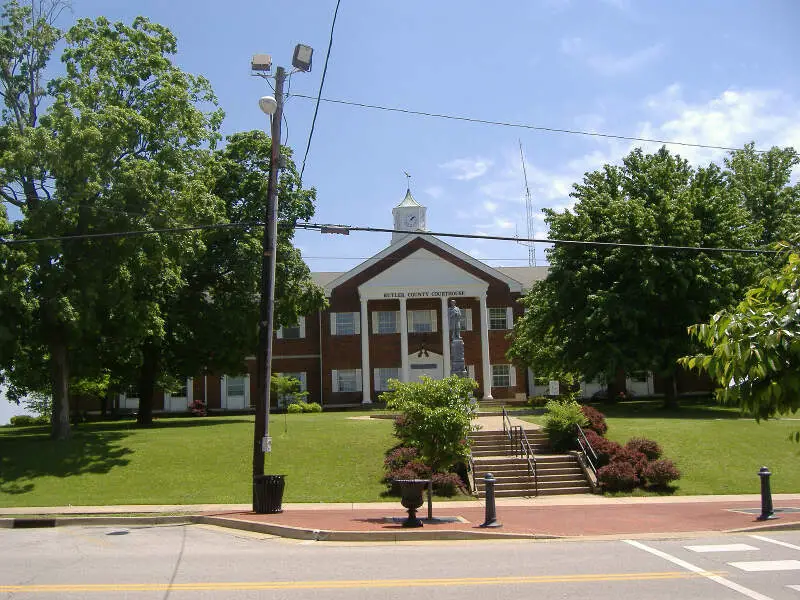
7. Morgantown
/10
Population: 2,734
Median Home Value: $133,317
Median Income: $29,103
Unemployment Rate: 11.7%
8. Liberty
/10
Population: 2,164
Median Home Value: $114,886
Median Income: $28,347
Unemployment Rate: 18.4%
9. Cloverport
/10
Population: 1,185
Median Home Value: $91,147
Median Income: $33,250
Unemployment Rate: 18.1%
10. Hickman
/10
Population: 1,884
Median Home Value: $54,875
Median Income: $31,000
Unemployment Rate: 4.9%
Methodology: How do you decide if a small place in Kentucky is lousy or not?
To rank the worst small towns to live in Kentucky, we had to determine what criteria people like or dislike about a place. Assuming that people like low crime, solid education, things to do, and a stable economy isn’t a stretch.
We then analyzed the criteria using Saturday Night Science, the thinking you’d use at a bar. It seems like even your crazy Uncle would agree that a town with high crime is worse than a town with low crime; all else the same.
Using FBI crime data and the Census’s 2018-2022 American Community Survey, this is the criteria we used:
- Population Density (The lower, the worse)
- Highest Unemployment Rates
- Low housing costs (meaning there’s no demand)
- Adjusted Median Income (Median income adjusted for the cost of living)
- Education (Number of high school dropouts)
- High Crime
We looked at cities with populations between 1,000 and 5,000 people, of which there were many – 159 to be exact.
We get the crime numbers from the FBI, which gets them from the cities. Dropout numbers are based on the adult population, not just the current graduation rates of teenagers.
We base all our research on facts, which is meant as infotainment. We updated this article for 2024, which is our tenth time ranking the worst small places to live in Kentucky.
There You Have It – The Worst Small Towns In Kentucky
If you’re analyzing teeny places in the Bluegrass State with the worst economic situations, where there’s high crime and there’s not a lot to do, this is an accurate list.
The worst small towns in Kentucky are Prestonsburg, Clay City, Pine Knot, Cumberland, Jenkins, Guthrie, Morgantown, Liberty, Cloverport, and Hickman.
If you’re curious enough, here are the best small towns to live in Kentucky, according to science:
- Beechwood Village (Pop. 1,302)
- Indian Hills (Pop. 2,891)
- Northfield (Pop. 1,106)
For more Kentucky reading, check out:
Worst Small Towns In Kentucky
| Rank | Town | Population | Unemployment Rate | Home Value | Median Income |
|---|---|---|---|---|---|
| 1 | Prestonsburg | 3,868 | 14.8% | $111,057 | $27,099 |
| 2 | Clay City | 1,567 | 11.9% | $115,738 | $22,929 |
| 3 | Pine Knot | 1,483 | 3.9% | $92,563 | $1,000 |
| 4 | Cumberland | 2,390 | 42.5% | $48,817 | $32,716 |
| 5 | Jenkins | 1,862 | 17.0% | $61,845 | $26,500 |
| 6 | Guthrie | 1,414 | 15.9% | $159,376 | $34,118 |
| 7 | Morgantown | 2,734 | 11.7% | $133,317 | $29,103 |
| 8 | Liberty | 2,164 | 18.4% | $114,886 | $28,347 |
| 9 | Cloverport | 1,185 | 18.1% | $91,147 | $33,250 |
| 10 | Hickman | 1,884 | 4.9% | $54,875 | $31,000 |
| 11 | Brownsville | 1,050 | 7.6% | $174,983 | $34,150 |
| 12 | Harlan | 1,908 | 11.8% | $82,436 | $24,936 |
| 13 | Brodhead | 1,361 | 12.1% | $137,554 | $28,750 |
| 14 | Beattyville | 1,956 | 11.4% | $112,642 | $23,423 |
| 15 | Clinton | 1,173 | 13.3% | $118,883 | $31,100 |
| 16 | Barbourville | 3,195 | 23.7% | $121,994 | $21,287 |
| 17 | Vanceburg | 1,303 | 7.3% | $62,959 | $25,089 |
| 18 | Cave City | 2,707 | 9.2% | $170,844 | $37,431 |
| 19 | Burkesville | 1,423 | 2.4% | $107,941 | $26,563 |
| 20 | Russell Springs | 2,713 | 8.1% | $139,665 | $34,219 |
| 21 | Edmonton | 1,898 | 10.1% | $139,109 | $47,841 |
| 22 | Salyersville | 1,880 | 8.1% | $111,006 | $29,280 |
| 23 | Earlington | 1,219 | 9.0% | $48,845 | $38,971 |
| 24 | Pineville | 1,796 | 11.7% | $71,685 | $27,159 |
| 25 | Irvine | 2,785 | 11.6% | $89,291 | $31,359 |
| 26 | Whitesburg | 2,153 | 17.6% | $86,993 | $32,663 |
| 27 | Breckinridge Center | 1,770 | 7.8% | $0 | $66,023 |
| 28 | Tompkinsville | 2,699 | 7.8% | $120,412 | $36,436 |
| 29 | Lewisburg | 1,084 | 9.5% | $176,346 | $35,469 |
| 30 | Munfordville | 1,746 | 4.5% | $157,726 | $26,953 |
| 31 | Elkhorn City | 1,013 | 14.7% | $70,167 | $43,819 |
| 32 | Dawson Springs | 2,026 | 11.4% | $99,960 | $34,615 |
| 33 | Flemingsburg | 2,955 | 16.6% | $155,896 | $37,857 |
| 34 | Stearns | 1,224 | 2.6% | $88,566 | $1,000 |
| 35 | Dry Ridge | 2,227 | 5.8% | $243,119 | $46,000 |
| 36 | Jamestown | 2,343 | 8.1% | $143,554 | $29,438 |
| 37 | Grayson | 3,841 | 13.4% | $137,469 | $27,045 |
| 38 | Providence | 2,883 | 8.2% | $77,062 | $49,954 |
| 39 | Dixon | 1,134 | 15.4% | $145,725 | $44,444 |
| 40 | Paintsville | 4,277 | 7.6% | $123,284 | $27,601 |
| 41 | Burnside | 1,081 | 2.6% | $84,039 | $52,847 |
| 42 | Fulton | 2,693 | 2.8% | $93,681 | $33,090 |
| 43 | Manchester | 2,195 | 3.6% | $97,138 | $30,474 |
| 44 | Whitley City | 1,148 | 0.0% | $84,226 | $22,702 |
| 45 | Horse Cave | 2,353 | 7.8% | $139,385 | $46,971 |
| 46 | Jackson | 2,286 | 9.6% | $72,263 | $33,333 |
| 47 | Camargo | 1,018 | 6.9% | $173,743 | $42,262 |
| 48 | Mount Vernon | 2,342 | 3.7% | $119,670 | $34,550 |
| 49 | Albany | 2,264 | 5.6% | $134,458 | $39,167 |
| 50 | Clay | 1,079 | 11.4% | $107,264 | $36,354 |
| 51 | Wurtland | 1,133 | 5.7% | $90,801 | $43,654 |
| 52 | Junction City | 2,166 | 9.8% | $155,825 | $38,646 |
| 53 | Farley | 4,559 | 3.9% | $93,150 | $45,257 |
| 54 | Irvington | 1,387 | 11.4% | $128,670 | $48,714 |
| 55 | Beaver Dam | 3,535 | 8.8% | $135,306 | $48,991 |
| 56 | Clarkson | 1,218 | 5.4% | $186,347 | $21,250 |
| 57 | Catlettsburg | 1,782 | 10.7% | $120,867 | $33,047 |
| 58 | Greensburg | 2,307 | 18.2% | $137,991 | $38,571 |
| 59 | Greenup | 1,068 | 7.4% | $100,450 | $43,036 |
| 60 | South Shore | 1,375 | 27.4% | $108,194 | $27,199 |
| 61 | Owingsville | 1,960 | 5.2% | $154,995 | $38,255 |
| 62 | Marion | 2,905 | 2.5% | $91,034 | $38,023 |
| 63 | Annville | 1,189 | 0.0% | $105,018 | $56,979 |
| 64 | Falmouth | 2,548 | 6.5% | $165,522 | $38,021 |
| 65 | Stanton | 3,214 | 6.0% | $137,688 | $29,097 |
| 66 | Lebanon Junction | 2,090 | 11.7% | $187,108 | $49,509 |
| 67 | Coal Run Village | 1,519 | 3.0% | $119,590 | $43,315 |
| 68 | Auburn | 1,645 | 8.8% | $207,108 | $40,259 |
| 69 | Sebree | 1,798 | 0.2% | $132,728 | $60,000 |
| 70 | Lancaster | 3,943 | 10.9% | $217,697 | $45,610 |
| 71 | Columbia | 4,811 | 5.8% | $130,093 | $45,163 |
| 72 | Jeffersonville | 1,833 | 8.8% | $169,423 | $52,031 |
| 73 | Cadiz | 2,618 | 2.2% | $73,326 | $39,439 |
| 74 | Owenton | 1,640 | 8.9% | $134,567 | $45,766 |
| 75 | Scottsville | 4,332 | 16.2% | $169,245 | $34,835 |
| 76 | Hawesville | 1,043 | 7.0% | $176,931 | $54,423 |
| 77 | West Point | 1,073 | 3.5% | $95,036 | $34,769 |
| 78 | White Plains | 1,009 | 3.2% | $129,033 | $41,125 |
| 79 | Carrollton | 3,889 | 8.0% | $145,181 | $48,333 |
| 80 | Calvert City | 2,524 | 3.8% | $140,552 | $39,974 |
| 81 | Elkton | 1,953 | 6.1% | $165,200 | $39,922 |
| 82 | North Corbin | 1,955 | 9.9% | $110,442 | $59,306 |
| 83 | Eddyville | 2,783 | 2.5% | $222,932 | $37,475 |
| 84 | Warsaw | 2,180 | 4.4% | $200,565 | $52,240 |
| 85 | Ledbetter | 1,815 | 9.6% | $146,156 | $60,667 |
| 86 | Eminence | 2,705 | 6.6% | $192,316 | $48,793 |
| 87 | Silver Grove | 1,335 | 5.4% | $156,350 | $43,975 |
| 88 | West Liberty | 3,247 | 3.1% | $106,992 | $47,083 |
| 89 | Hardinsburg | 2,476 | 6.9% | $156,524 | $52,684 |
| 90 | Muldraugh | 1,221 | 8.4% | $124,730 | $49,375 |
| 91 | Augusta | 1,599 | 12.0% | $154,527 | $50,135 |
| 92 | Sturgis | 1,693 | 3.7% | $102,097 | $39,148 |
| 93 | Raceland | 2,015 | 7.2% | $123,558 | $60,398 |
| 94 | Louisa | 2,652 | 7.9% | $148,644 | $49,583 |
| 95 | Westwood | 4,581 | 3.1% | $94,173 | $66,125 |
| 96 | West Buechel | 1,936 | 4.8% | $170,683 | $48,750 |
| 97 | Campbellsburg | 1,045 | 9.1% | $202,752 | $53,512 |
| 98 | Worthington | 1,722 | 2.8% | $115,062 | $60,972 |
| 99 | Pleasureville | 1,223 | 2.5% | $152,802 | $47,436 |
| 100 | Verona | 1,146 | 3.4% | $286,365 | $68,398 |

This is absouletly not true about Kenvir and Cawood. Yes, there aren’t many jobs but these places are very safe to live. Very little crime. Some of the best people live in these tight knit communities where they help each other. I live in Harlan County, I was born here and will die here. I am very offended about the negative remarks made about our communities.
Has the writer done so much as visited Glencoe and tried to talk to it’s citizens? I detest the insulting conclusion in this ” article”. Where do you get your information? Research? Talking to people? Any of that?
They get their data from sheriff’s office, Kentucky state police, unemployment office, news paper reports, federal census records, average pay rate, rate of population who lives under the poverty level, crime rate, cost of living, unemployment rate, number of things to do, how far you have to travel to find work, number of jobs available, drop out rate for all citizens living there not just the ones currently dropping out, teen pregnancy rate, and much much more
I was living in Prestonville for over 5 years and I was manager in McDonald’s of Carrollton in first shift and manager in McDonald’s of Madison in second shift then if the people is poor there is because they are lazy ,also farmers raise a lot tobacco,about the safety l have 15 years living in this country and is the only place that someone broke into my house, l am sure my neighbors were…..bad,bad experience….
There is good and bad in every community..I’m sure where this writer lives Everything is just perfect..Don’t blame everyone who lives in these places on a few bad apples..It’s the scourge of drugs that’s ripping these places apart
We moved here to retire and love Kentucky, but there is that feud attitude with some. Sad…
This list is inaccurate it doesn’t include Mayfield .worst city in KY 3 years running.