Do you like the suburbs? Most of America lives in either a large city or in a suburb of a larger city.
The suburbs have obvious benefits – less crime, a slower pace of life, and a lower cost of living. But not all American suburbs aren’t created equal. There are some outlying areas that are, frankly, pretty lousy. But which ones?
Instead of relying on public opinion and speculation, we wanted to get the facts straight and dug into the data to find out which suburbs are to be avoided. If you’re in one of the places we’re about to highlight, odds are you know things aren’t a place that you can let your guard down too often.
Turns out Prichard, Alabama is the worst suburb where you can live in this country. The best? West University Place, a Houston burb.
Here are the worst suburbs in America:
- Prichard, AL
- Adelanto, CA
- West Memphis, AR
- Bessemer, AL
- Moss Point, MS
- Sebring, FL
- Cahokia, IL
- Freeport, TX
- Romulus, MI
- Mercedes, TX
So basically, large parts of the south (especially Alabama) are the areas you want to avoid if you want to enjoy suburbia in America. At least generally.
Or, if you’re interested in reading something else, check out:
- Best States In America
- Cheapest States To Live In
- Worst Mid-Sized Cities
- Cheapest Cities To Live In America
The 10 Worst Suburbs In The United States
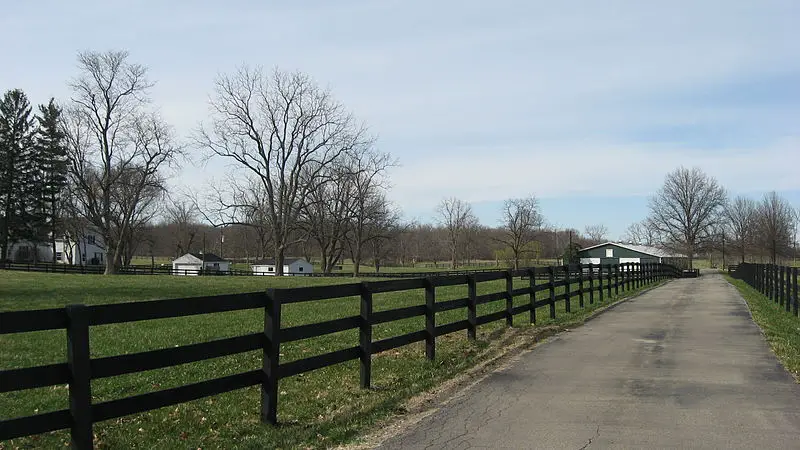
1. Prichard, AL
Population: 22,483
College educated: 10%
Unemployment rate: 21%
Incomes: $21,293
The Mobile suburb of Prichard has the unfortunate distinction of having two ‘21s’ in its data set – 21% of the population is out of work, and the average family earns about $21,000 a year. That’s far below what a typical American family of 4 needs to live comfortably each month.
2. Adelanto, CA

Population: 31,273
College educated: 6%
Unemployment rate: 25%
Incomes: $35,393
Adelanto is considered a Victorville suburb, but is a Los Angeles suburb as well. The fact that more than 1 in 4 people is out of work is an indication of the commitment Adelanto residents have towards earning a decent living. There are plenty of jobs in Southern California.
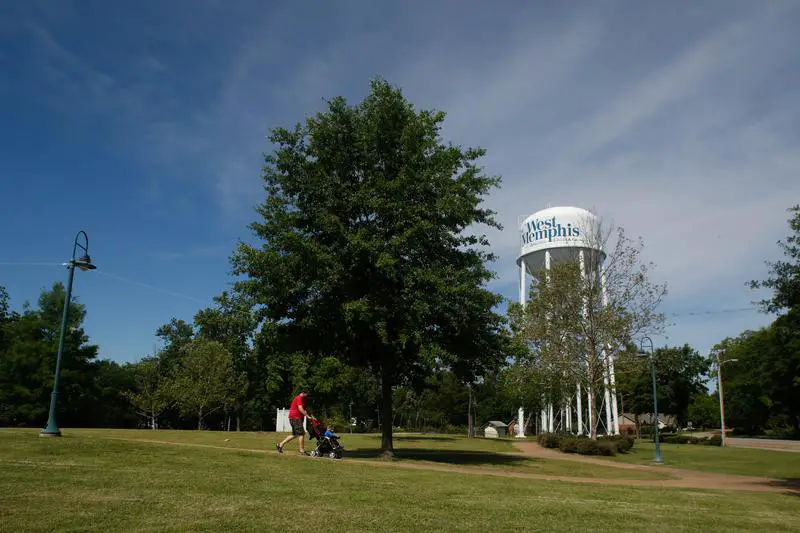
3. West Memphis, AR
Population: 25,384
College educated: 11%
Unemployment rate: 15%
Incomes: $30,384
Memphis itself is atop lots of lists for being a dangerous, poor place to live. Arkansas’ West Memphis is the worst of its suburbs, where 1 in 6 residents is out of work, and where many families struggle to make ends meet each month.
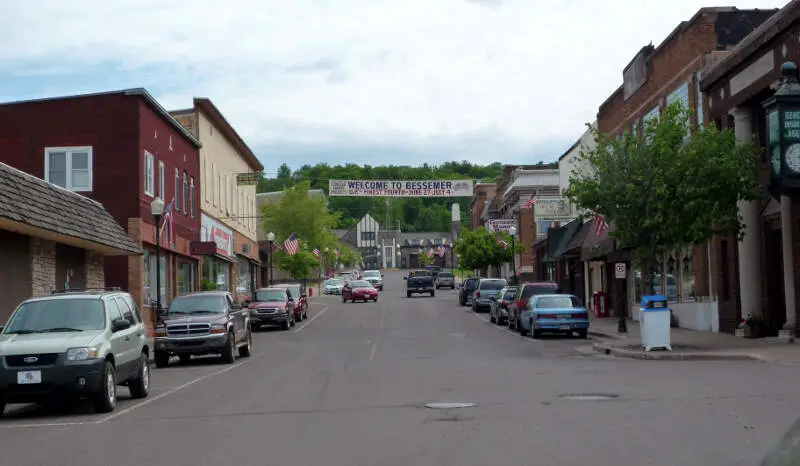
4. Bessemer, AL
Population: 27,702
College educated: 12%
Unemployment rate: 14%
Incomes: $30,934
The Birmingham suburb of Bessemer had one of the lowest income levels for southern suburbs, but at least 12% of the population has a college degree. That’s high for cities on this list. What was once an ore mining and railroad hub has since gone away, taking jobs and incomes with it.
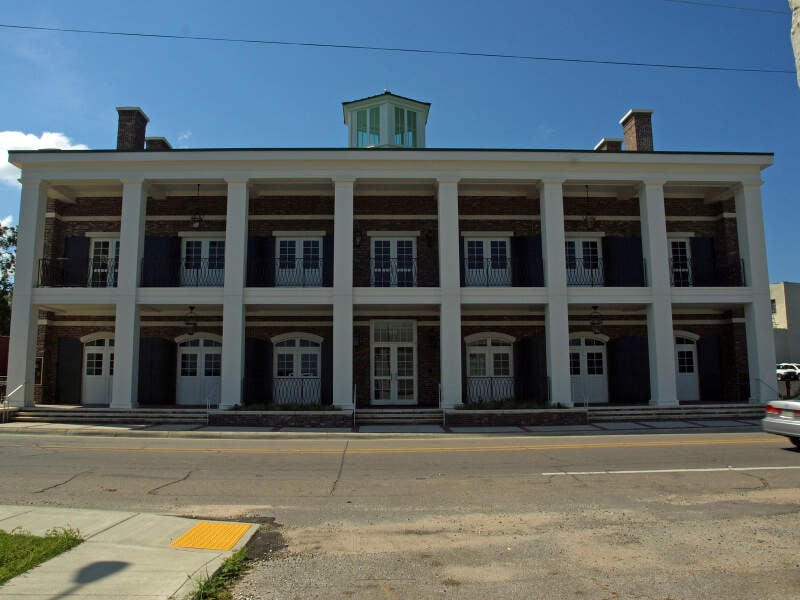
5. Moss Point, MS
Population: 13,298
College educated: 14%
Unemployment rate: 16%
Incomes: $27,093
This Pascagoula, Mississippi suburb gets low marks for the number of folks out of work and income levels, which are the key reasons why the home prices here are hovering near the $87,000 mark.
There were 16 rapes, 31 robberies, 71 assaults, 411 burglaries, 311 larceny counts and 70 auto thefts per year here. The crime index average for 3 years is 615.8 per 100,000. The U.S. average is 309.2
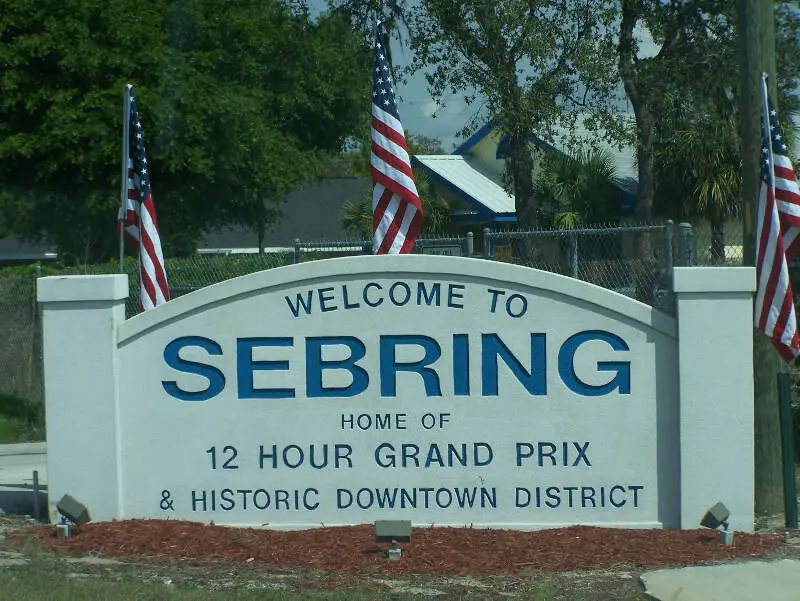
6. Sebring, FL
Population: 10,364
College educated: 14%
Unemployment rate: 16%
Incomes: $27,203
An Avon Park suburb, Sebring sees about 1 in 6 residents fail to find a job each year, and families simply struggle to make ends meet each year. On the bright side, there are more things to do in the general area here than in many of the cities listed above.
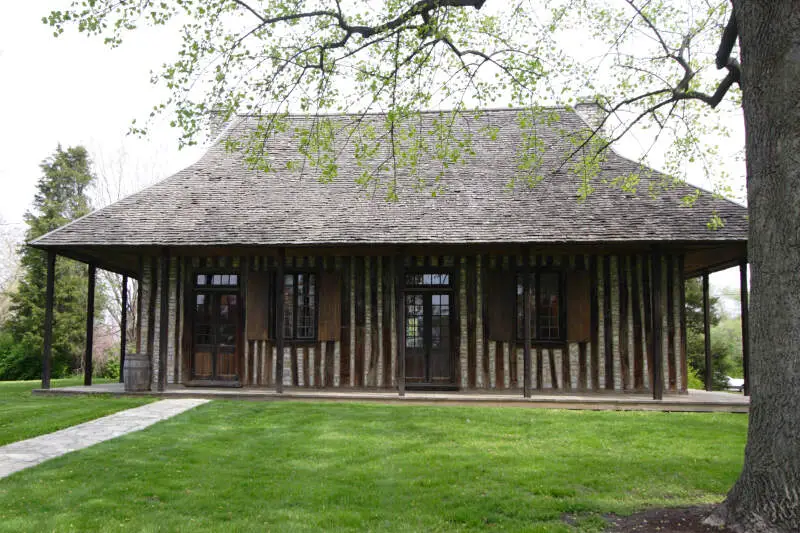
7. Cahokia, IL
Population: 15,000
College educated: 7%
Unemployment rate: 16%
Incomes: $30,294
Parts of St. Louis rank consistently low for high crime and bad economies. Cahokia, a village in Illinois, is one of the lousiest cities in the general St. Louis area, where only 7% of the population has a decent education.
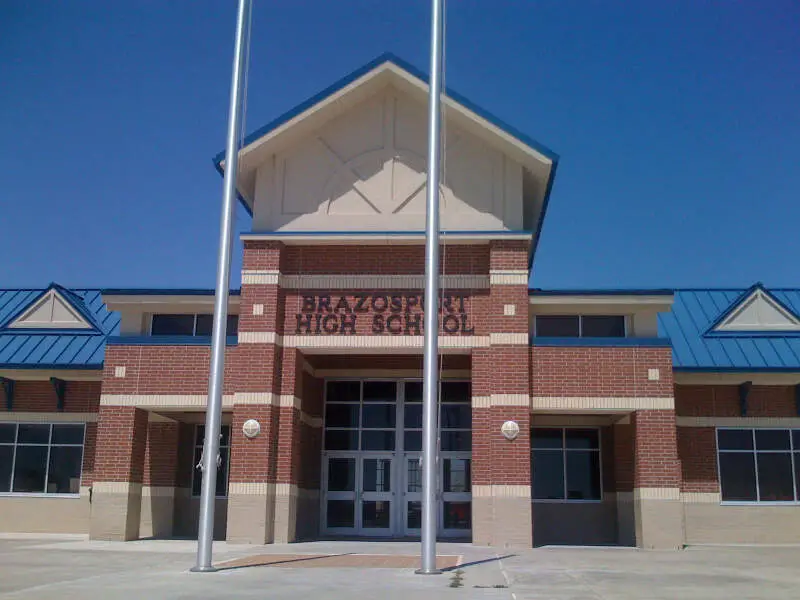
8. Freeport, TX
Population: 12,128
College educated: 8%
Unemployment rate: 11%
Incomes: $36,293
Freeport is a Lake Jackson suburb in Texas, where things aren’t going very well right now. An 11% unemployment rate is actually not too bad for cities on this list, but about double the national average. Homes here average only about $66,000 each, which is very low, even for parts of the Lone Star State.
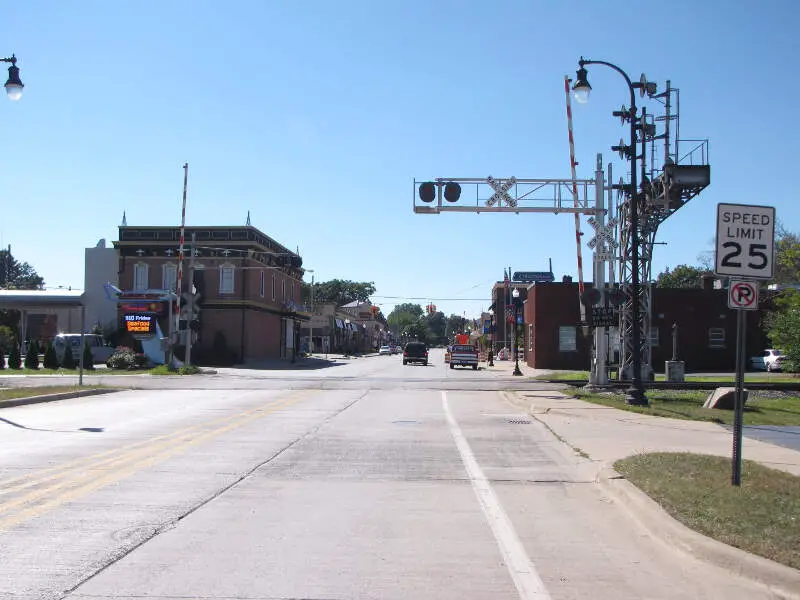
9. Romulus, MI
Population: 23,293
College educated: 11%
Unemployment rate: 16%
Incomes: $44,293
Detroit is trying to make a resurgence, but many of the areas surrounding Detroit are in dire straits. Here in Romulus, income levels are higher than most cities on this list, but a lot of folks are out of work, and crime is far higher than the state average.
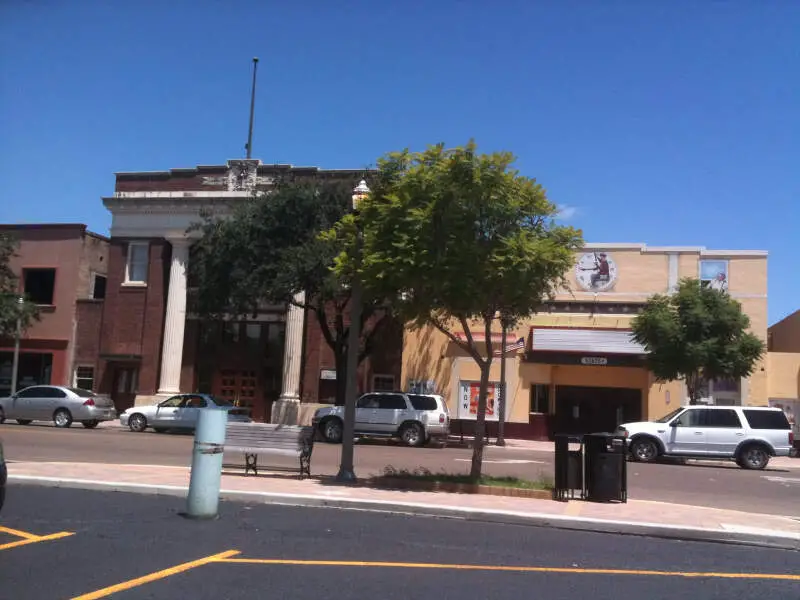
10. Mercedes, TX
College educated: 12%
Unemployment rate: 18%
Incomes: $30,213
We round out the nation’s worst suburbs with Mercedes, another city in Texas where folks are struggling. Nearly 1 in 5 potential workers can’t find a job, and homes are some of the cheapest in the entire state.
That’s certainly a sign that there’s no demand to live here.
The Worst Suburbs In The US – There You Have It
When you’re looking at American suburbs that have really bad local economies, this is an accurate list.
Here are the best suburbs in America:
- West University Place, TX
- Piedmont, CA
- Key Biscayne Village, FL
- Hoboken, NJ
- Bellaire, TX
How do you decide if a suburb is lousy or not?
We threw a lot of criteria at this one in order to get the best, most complete results possible. Using the government census, this is the criteria we used:
- Low college graduates
- High unemployment rates
- Low incomes
- Low home prices
- Low population densities
We only considered suburbs that were over 10,000 people.
Detailed List Of The Worst Suburbs In America
| City | Suburb Of | Rank | Population | College Educated | Unemployment Rate |
|---|---|---|---|---|---|
| Prichard | Mobile, AL Urbanized Area | 1 | 22,475 | 9.6% | 20.9% |
| Adelanto | Victorville–Hesperia, CA Urbanized Area | 2 | 31,773 | 6.4% | 25.5% |
| West Memphis | Memphis, TN–MS–AR Urbanized Area | 3 | 25,767 | 11.3% | 14.9% |
| Bessemer | Birmingham, AL Urbanized Area | 4 | 27,202 | 12.8% | 14.2% |
| Moss Point | Pascagoula, MS Urbanized Area | 5 | 13,690 | 13.9% | 16.7% |
| Sebring | Sebring–Avon Park, FL Urbanized Area | 6 | 10,356 | 13.8% | 16.7% |
| Cahokia | St. Louis, MO–IL Urbanized Area | 7 | 14,905 | 7.3% | 15.9% |
| Freeport | Lake Jackson–Angleton, TX Urbanized Area | 8 | 12,108 | 8.3% | 11.6% |
| Romulus | Detroit, MI Urbanized Area | 9 | 23,721 | 10.8% | 16.5% |
| Mercedes | Harlingen, TX Urbanized Area | 10 | 16,271 | 12.7% | 18.3% |
| Mercedes | McAllen, TX Urbanized Area | 11 | 16,271 | 12.7% | 18.3% |
| Benton Harbor | Benton Harbor–St. Joseph–Fair Plain, MI Urbanized Area | 12 | 10,056 | 4.5% | 28.4% |
| East St. Louis | St. Louis, MO–IL Urbanized Area | 13 | 26,697 | 8.0% | 16.4% |
| Gary | Chicago, IL–IN Urbanized Area | 14 | 79,165 | 13.1% | 18.8% |
| Lexington | Winston-Salem, NC Urbanized Area | 15 | 19,029 | 14.0% | 18.5% |
| Lake Station | Chicago, IL–IN Urbanized Area | 16 | 12,369 | 5.4% | 16.5% |
| San Benito | Harlingen, TX Urbanized Area | 17 | 24,447 | 8.7% | 12.3% |
| Apache Junction | Phoenix–Mesa, AZ Urbanized Area | 18 | 36,965 | 12.9% | 16.3% |
| Forest Park | Atlanta, GA Urbanized Area | 19 | 18,783 | 8.0% | 17.1% |
| Socorro | El Paso, TX–NM Urbanized Area | 20 | 32,623 | 6.8% | 13.1% |
| Kings Mountain | Gastonia, NC–SC Urbanized Area | 21 | 10,743 | 12.6% | 15.5% |
| Kings Mountain | Shelby, NC Urban Cluster | 22 | 10,743 | 12.6% | 15.5% |
| Lenoir | Hickory, NC Urbanized Area | 23 | 18,061 | 15.3% | 16.3% |
| Spring Lake | Fayetteville, NC Urbanized Area | 24 | 13,101 | 17.9% | 16.1% |
| Trotwood | Dayton, OH Urbanized Area | 25 | 24,322 | 15.3% | 12.5% |
| Anniston | Anniston–Oxford, AL Urbanized Area | 26 | 22,749 | 20.9% | 16.3% |
| East Chicago | Chicago, IL–IN Urbanized Area | 27 | 29,387 | 7.5% | 17.0% |
| Florida City | Miami, FL Urbanized Area | 28 | 11,853 | 5.3% | 28.7% |
| Sunland Park | El Paso, TX–NM Urbanized Area | 29 | 14,794 | 11.5% | 12.0% |
| Kelso | Longview, WA–OR Urbanized Area | 30 | 11,837 | 10.0% | 22.5% |
| Cocoa | Palm Bay–Melbourne, FL Urbanized Area | 31 | 17,261 | 15.9% | 16.1% |
| Leesburg | Leesburg–Eustis–Tavares, FL Urbanized Area | 32 | 20,915 | 19.3% | 17.1% |
| Newton | Hickory, NC Urbanized Area | 33 | 12,998 | 15.1% | 12.7% |
| Muskegon Heights | Muskegon, MI Urbanized Area | 34 | 10,807 | 5.0% | 27.0% |
| Lake Wales | Crooked Lake Park, FL Urban Cluster | 35 | 14,665 | 19.2% | 19.1% |
| Lake Wales | Winter Haven, FL Urbanized Area | 36 | 14,665 | 19.2% | 19.1% |
| Bellmead | Waco, TX Urbanized Area | 37 | 10,052 | 6.1% | 10.2% |
| Burton | Flint, MI Urbanized Area | 38 | 29,429 | 15.0% | 16.3% |
| Orange City | Deltona, FL Urbanized Area | 39 | 10,968 | 15.5% | 13.1% |
| Covington | Atlanta, GA Urbanized Area | 40 | 13,342 | 13.8% | 10.8% |
| Texas City | Houston, TX Urbanized Area | 41 | 45,802 | 12.5% | 12.2% |
| Niles | South Bend, IN–MI Urbanized Area | 42 | 11,479 | 11.9% | 13.9% |
| Pontiac | Detroit, MI Urbanized Area | 43 | 59,658 | 11.0% | 21.0% |
| Fort Pierce | Port St. Lucie, FL Urbanized Area | 44 | 42,744 | 13.9% | 16.3% |
| Union City | Atlanta, GA Urbanized Area | 45 | 20,200 | 20.2% | 14.6% |
| Donna | McAllen, TX Urbanized Area | 46 | 16,169 | 11.9% | 11.6% |
| Cottonwood | Cottonwood–Verde Village, AZ Urban Cluster | 47 | 11,358 | 16.1% | 12.2% |
| Highland Park | Detroit, MI Urbanized Area | 48 | 10,951 | 10.8% | 35.0% |
| Bartow | Lakeland, FL Urbanized Area | 49 | 17,766 | 17.0% | 11.3% |
| Moss Point | Pascagoula, MS Urbanized Area | 5 | 13,690 | 13.9% | 16.7% |
Worst Places By State
Most Dangerous Cities In Alaska
Most Dangerous Cities In Alabama
Most Dangerous Places In Arkansas
Most Dangerous Cities In Arizona
Most Dangerous Cities In California
Most Dangerous Cities In Colorado
Most Dangerous Cities In Connecticut
Most Dangerous Cities In Delaware
Most Dangerous Places In Florida
Most Dangerous Places In Georgia
Most Dangerous Cities In Idaho
Most Dangerous Cities In Illinois
Most Dangerous Cities In Indiana
Most Dangerous Places In Kansas
Most Dangerous Cities In Massachusetts
Most Dangerous Cities In Maryland
Most Dangerous Cities In Maine
Most Dangerous Places In Michigan
Most Dangerous Cities In Minnesota
Most Dangerous Cities In Missouri
Most Dangerous Cities In Mississippi
Most Dangerous Cities In Montana
Most Dangerous Cities In North Carolina
Most Dangerous Cities In North Dakota
Most Dangerous Cities In Nebraska
Most Dangerous Cities In New Hampshire
Most Dangerous Cities In New Jersey
Most Dangerous Cities In New Mexico
5 Most Dangerous Cities In Nevada
Most Dangerous Cities In Oklahoma
Most Dangerous Cities In Oregon
Most Dangerous Cities In Pennsylvania
Most Dangerous Cities In Rhode Island
Most Dangerous Cities In South Carolina
Most Dangerous Cities In South Dakota
Most Dangerous Cities In Tennessee
Most Dangerous Places In Texas
Most Dangerous Cities In Virginia
Most Dangerous Cities In Vermont
Most Dangerous Cities In Washington
Most Dangerous Cities In Wisconsin
